
 Nasdaq
 華爾街日報
華爾街日報RH (RH) Valuation Check After Recent Share Price Rebound
RH (RH) shares have bounced about 2 % over the past day and roughly 6 % in the past week, giving investors a reason to revisit whether this beaten down luxury retailer is mispriced.
See our latest analysis for RH.
That bounce comes after a tough stretch, with the 90 day share price return still down sharply and the 1 year total shareholder return deeply negative. This suggests recent momentum may be more of a tentative reset than a full trend change.
If RH’s volatility has you rethinking your watchlist, it could be a good moment to explore other specialty retailers and design names, or broaden out to fast growing stocks with high insider ownership.
With shares still down sharply over the past year yet trading at a sizable discount to both analyst targets and some intrinsic estimates, investors now face a key question: is RH an underappreciated recovery story or is future growth already captured in the price?
Most Popular Narrative Narrative: 36.1% Undervalued
Compared to RH’s last close at $167.59, the most popular narrative points to a materially higher fair value, built on aggressive profit and margin expansion.
The company's plans to monetize assets, including real estate with an estimated equity value of approximately $500 million and excess inventory valued at $200 million to $300 million, could boost cash flow and help in reducing debt, potentially improving net margins and lowering interest expenses.
Curious how modest revenue gains could still translate into a step change in profitability. The narrative leans on sharply higher margins and a very different earnings base. Want to see which future profit profile has to become reality for this valuation to make sense.
Result: Fair Value of $262.25 (UNDERVALUED)
Have a read of the narrative in full and understand what's behind the forecasts.
However, a weaker housing market and pressure from tariffs or higher debt costs could easily derail the margin and earnings expansion built into this view.
Find out about the key risks to this RH narrative.
Another View: Market Multiple Sends a Different Signal
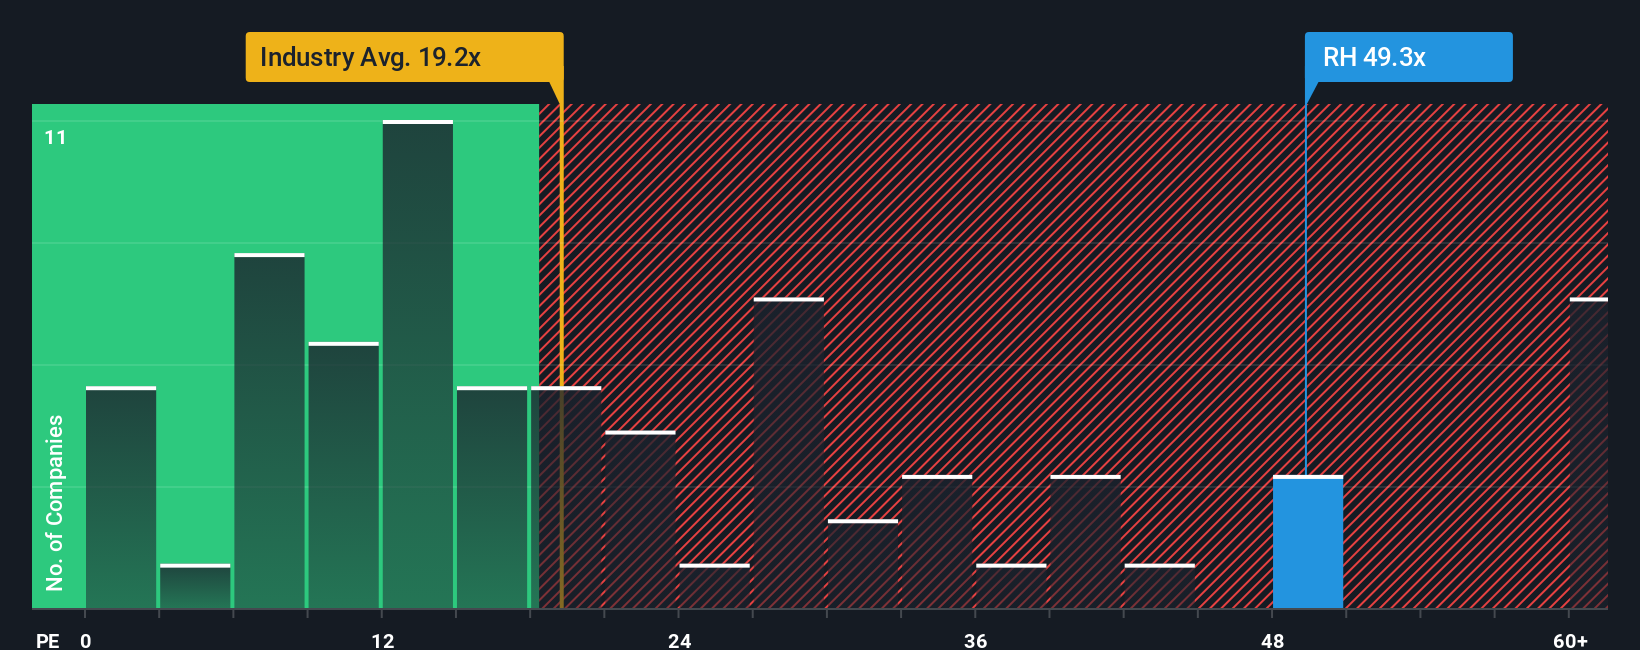
Market based metrics paint a more cautious picture. RH trades at a price to earnings ratio of 28.6 times, richer than both peers at 18.9 times and the US Specialty Retail average at 20.3 times. It is only slightly below its fair ratio of 30.1 times, hinting at limited margin for error.
See what the numbers say about this price — find out in our valuation breakdown.
Build Your Own RH Narrative
If you see the numbers differently or want to stress test your own assumptions, you can quickly build a personalized RH story in under three minutes: Do it your way.
A great starting point for your RH research is our analysis highlighting 3 key rewards and 2 important warning signs that could impact your investment decision.
Looking for more investment ideas?
Before you move on, lock in your next opportunity by using the Simply Wall Street Screener to surface focused lists of stocks that match your strategy.
- Capture potential high-return opportunities early by scanning these 3627 penny stocks with strong financials that already show strong underlying financials.
- Position your portfolio at the frontier of innovation by targeting these 25 AI penny stocks harnessing breakthroughs in artificial intelligence.
- Strengthen your long term income stream by zeroing in on these 13 dividend stocks with yields > 3% that can keep paying you while markets fluctuate.
This article by Simply Wall St is general in nature. We provide commentary based on historical data and analyst forecasts only using an unbiased methodology and our articles are not intended to be financial advice. It does not constitute a recommendation to buy or sell any stock, and does not take account of your objectives, or your financial situation. We aim to bring you long-term focused analysis driven by fundamental data. Note that our analysis may not factor in the latest price-sensitive company announcements or qualitative material. Simply Wall St has no position in any stocks mentioned.
Have feedback on this article? Concerned about the content? Get in touch with us directly. Alternatively, email editorial-team@simplywallst.com