
 Nasdaq
 華爾街日報
華爾街日報Is It Too Late to Consider CyberArk After Its 249% Three Year Rally?
- Wondering if CyberArk Software is still worth buying after such a massive run, or if the smart move now is to wait for a better entry point? You are not alone, plenty of investors are trying to figure out whether the current price reflects its true value.
- The stock has cooled off a bit in the short term, down around 3.8% over the last week and 7.4% over the past month, but it is still up 34.5% year to date and roughly 42.1% over the last year. Zoom out further and the 3 year gain of about 249.4% and 5 year gain of 177.3% highlight the strength of this longer term trend.
- Those moves have been driven by CyberArk's position as a key player in identity security and privileged access management, areas that are increasingly central to how enterprises defend themselves against cyber threats. As large organizations increase cybersecurity spending and regulators tighten expectations around identity management, CyberArk has been landing strategic customer wins and expanding its platform. This helps explain why the market has been willing to re rate the stock over time.
- Despite that momentum, CyberArk currently scores just 0/6 on our valuation checks, meaning it does not screen as undervalued on any of the standard metrics we use. Next we will walk through those different valuation approaches to see what they are really telling us, then circle back at the end with a more nuanced way of thinking about CyberArk's value that goes beyond the usual multiples.
CyberArk Software scores just 0/6 on our valuation checks. See what other red flags we found in the full valuation breakdown.
Approach 1: CyberArk Software Discounted Cash Flow (DCF) Analysis
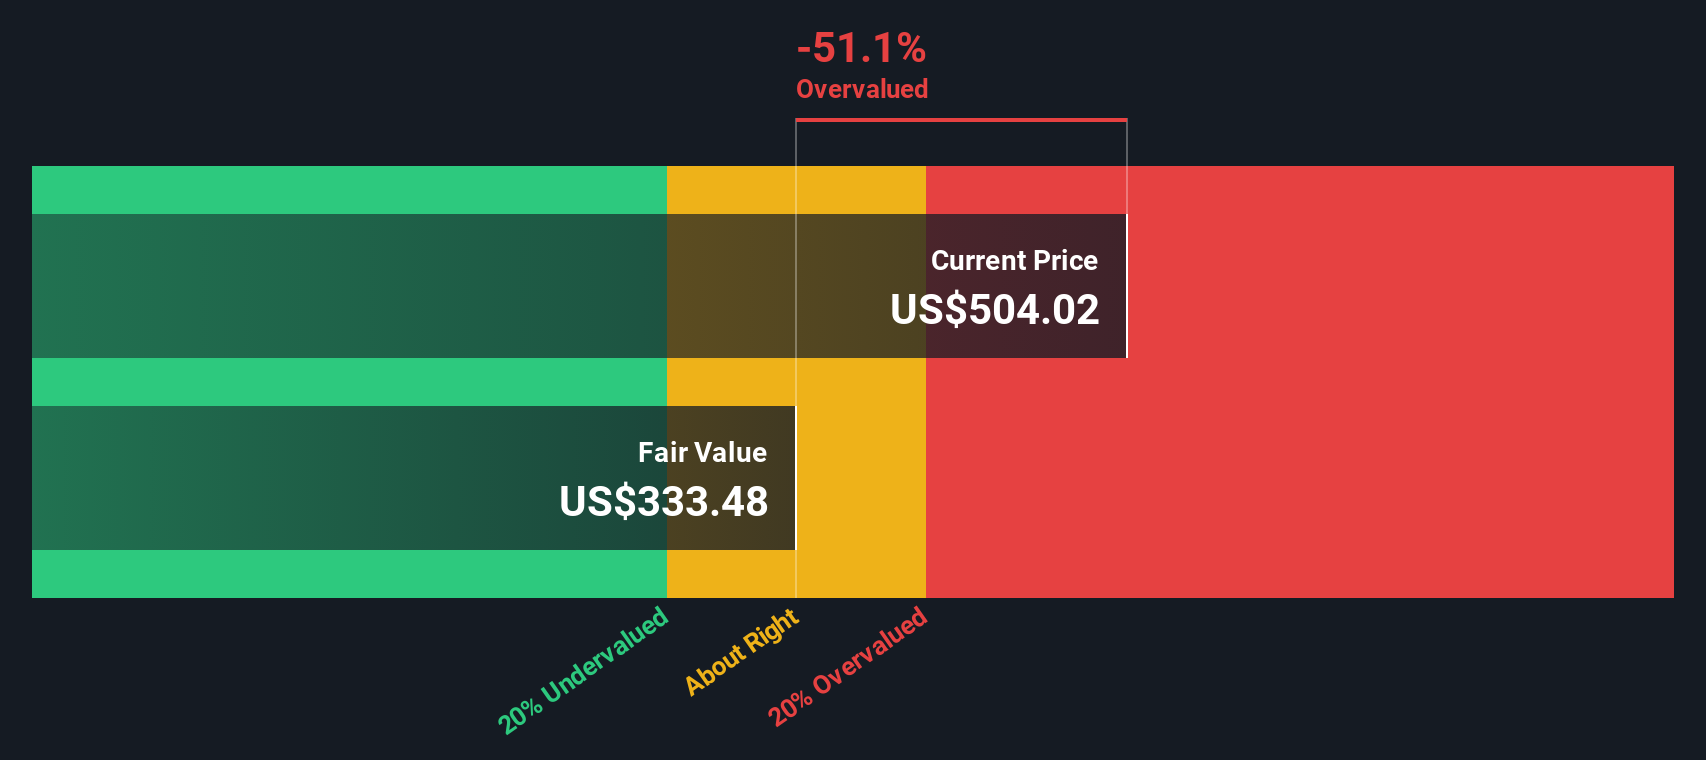
A Discounted Cash Flow model estimates what a company is worth by projecting its future cash flows and then discounting those back to today in $ terms. For CyberArk Software, the model starts with last twelve month free cash flow of about $205.1 million and assumes this figure grows significantly as the business scales.
Analysts and internal estimates see free cash flow rising to roughly $2.13 billion by 2035, with intermediate milestones such as about $390.1 million in 2026 and $1.03 billion by 2029. These projections are based on a 2 Stage Free Cash Flow to Equity model, where earlier years lean more heavily on analyst forecasts and later years are extrapolated by Simply Wall St as growth gradually slows.
When all those future cash flows are discounted back, the intrinsic value comes out at about $338.76 per share. Compared with the current market price, this indicates CyberArk is estimated to be roughly 33.3% overvalued, which indicates investors may already be paying up for a lot of future growth.
Result: OVERVALUED
Our Discounted Cash Flow (DCF) analysis suggests CyberArk Software may be overvalued by 33.3%. Discover 909 undervalued stocks or create your own screener to find better value opportunities.
Approach 2: CyberArk Software Price vs Sales
For growing software businesses that are still ramping profitability, the Price to Sales ratio is often the cleanest way to compare value, because revenue tends to be more stable than earnings and less affected by accounting choices. Investors are generally willing to pay a higher sales multiple for companies with faster, more predictable growth and lower perceived risk, while slower or riskier names usually command lower multiples.
CyberArk currently trades on a Price to Sales ratio of about 17.50x, a hefty premium to both the broader Software industry average of roughly 4.81x and its closest peers at about 9.36x. To move beyond these blunt comparisons, Simply Wall St uses a proprietary Fair Ratio, which estimates what a reasonable Price to Sales multiple should be after factoring in CyberArk's growth outlook, profitability profile, risk, industry positioning and market cap. This is more tailored than just lining the stock up against generic sector averages or a small peer set.
On that basis, CyberArk's Fair Ratio is 9.07x, well below the current 17.50x. This suggests the market is pricing in more optimism than our fundamentals based model supports.
Result: OVERVALUED
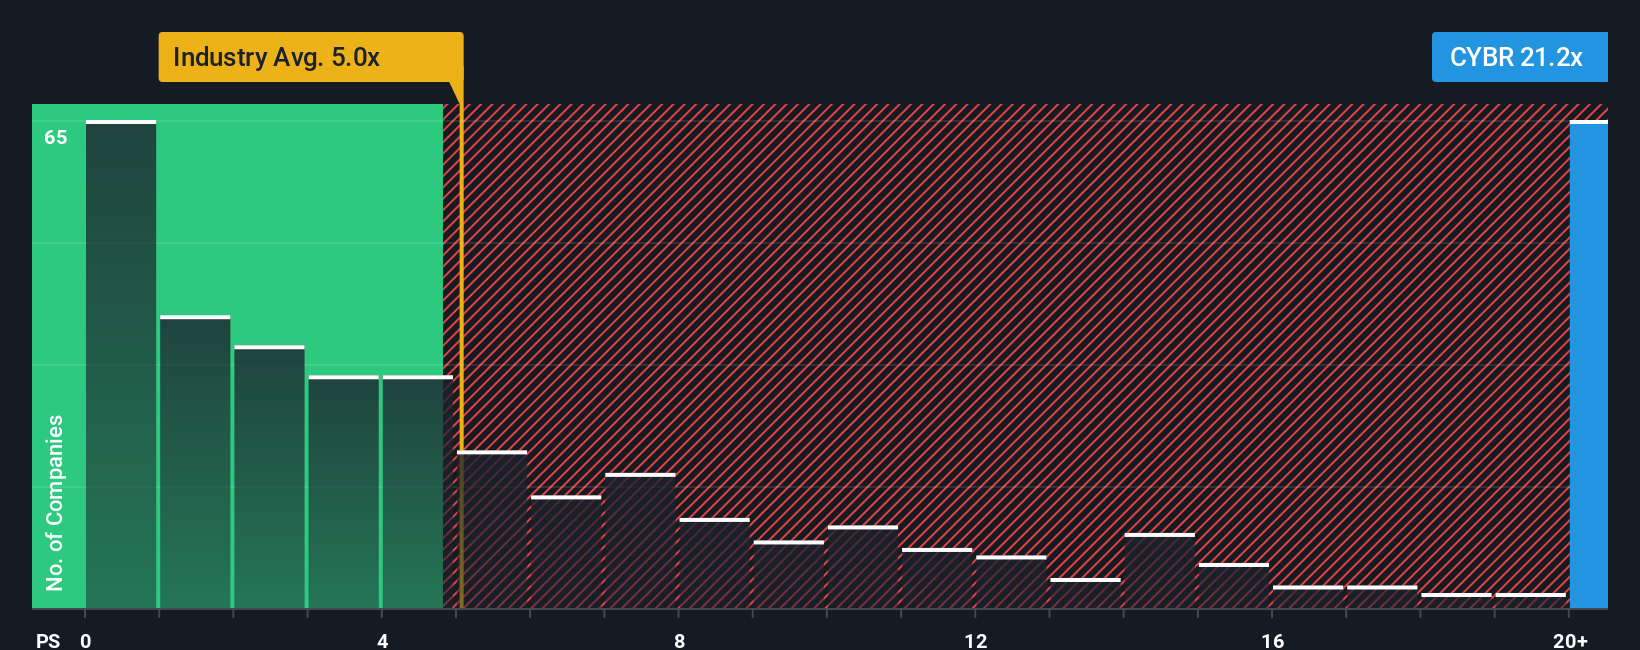
PS ratios tell one story, but what if the real opportunity lies elsewhere? Discover 1456 companies where insiders are betting big on explosive growth.
Upgrade Your Decision Making: Choose your CyberArk Software Narrative
Earlier we mentioned that there is an even better way to understand valuation, so let us introduce you to Narratives, a simple framework on Simply Wall St's Community page where you connect your view of a company’s story to specific assumptions about future revenue, earnings and margins, which then flow through into a clear fair value estimate you can compare with today’s share price to decide whether to buy, hold or sell. Narratives are easy to use, they are updated dynamically when new information like earnings or major news hits, and they make it obvious how different perspectives lead to different values. For example, one CyberArk Narrative might lean into AI security upside, strong Venafi and Zilla integration and a higher fair value above $550, while a more cautious Narrative could focus on execution risks, competition and deal uncertainty and land closer to $415. This provides a practical range to anchor your own decision.
Do you think there's more to the story for CyberArk Software? Head over to our Community to see what others are saying!

This article by Simply Wall St is general in nature. We provide commentary based on historical data and analyst forecasts only using an unbiased methodology and our articles are not intended to be financial advice. It does not constitute a recommendation to buy or sell any stock, and does not take account of your objectives, or your financial situation. We aim to bring you long-term focused analysis driven by fundamental data. Note that our analysis may not factor in the latest price-sensitive company announcements or qualitative material. Simply Wall St has no position in any stocks mentioned.
Have feedback on this article? Concerned about the content? Get in touch with us directly. Alternatively, email editorial-team@simplywallst.com