
 Nasdaq
 華爾街日報
華爾街日報These 4 Measures Indicate That Kunlun Energy (HKG:135) Is Using Debt Reasonably Well
Legendary fund manager Li Lu (who Charlie Munger backed) once said, 'The biggest investment risk is not the volatility of prices, but whether you will suffer a permanent loss of capital.' It's only natural to consider a company's balance sheet when you examine how risky it is, since debt is often involved when a business collapses. We note that Kunlun Energy Company Limited (HKG:135) does have debt on its balance sheet. But the real question is whether this debt is making the company risky.
Why Does Debt Bring Risk?
Debt assists a business until the business has trouble paying it off, either with new capital or with free cash flow. Part and parcel of capitalism is the process of 'creative destruction' where failed businesses are mercilessly liquidated by their bankers. While that is not too common, we often do see indebted companies permanently diluting shareholders because lenders force them to raise capital at a distressed price. Of course, debt can be an important tool in businesses, particularly capital heavy businesses. When we examine debt levels, we first consider both cash and debt levels, together.
How Much Debt Does Kunlun Energy Carry?
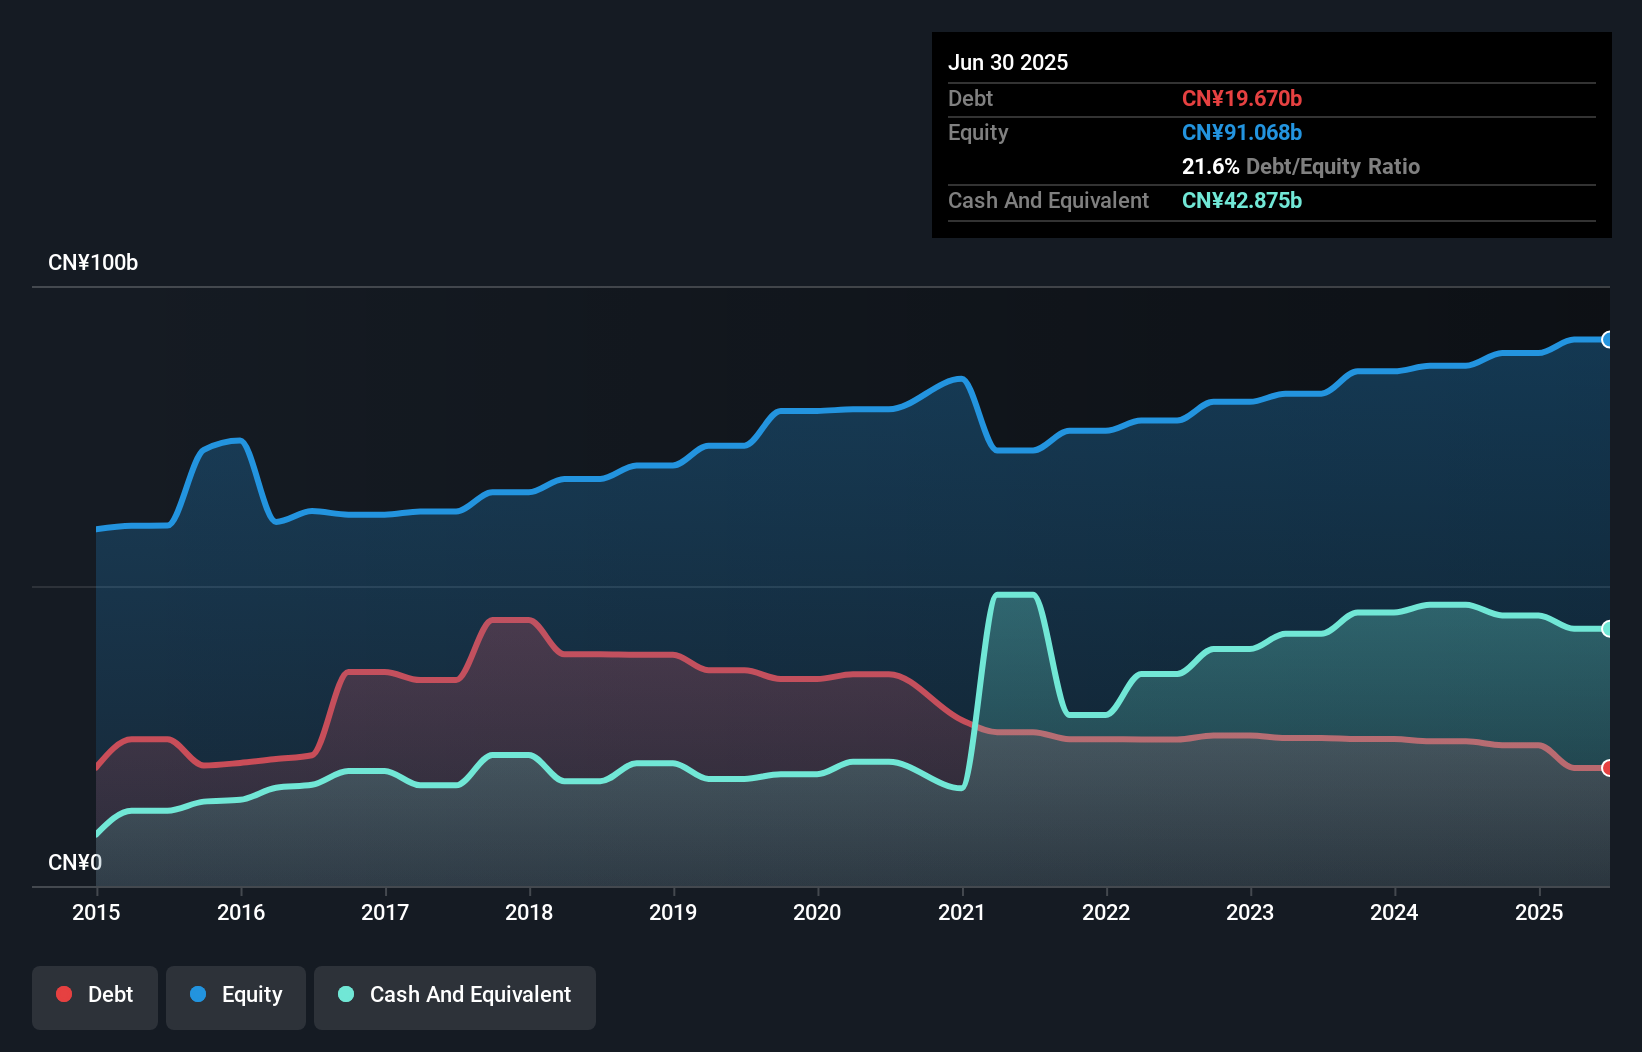
As you can see below, Kunlun Energy had CN¥19.7b of debt at June 2025, down from CN¥24.1b a year prior. However, it does have CN¥42.9b in cash offsetting this, leading to net cash of CN¥23.2b.
How Strong Is Kunlun Energy's Balance Sheet?
Zooming in on the latest balance sheet data, we can see that Kunlun Energy had liabilities of CN¥29.8b due within 12 months and liabilities of CN¥20.0b due beyond that. On the other hand, it had cash of CN¥42.9b and CN¥3.40b worth of receivables due within a year. So its liabilities total CN¥3.48b more than the combination of its cash and short-term receivables.
Of course, Kunlun Energy has a market capitalization of CN¥58.0b, so these liabilities are probably manageable. But there are sufficient liabilities that we would certainly recommend shareholders continue to monitor the balance sheet, going forward. While it does have liabilities worth noting, Kunlun Energy also has more cash than debt, so we're pretty confident it can manage its debt safely.
See our latest analysis for Kunlun Energy
On the other hand, Kunlun Energy saw its EBIT drop by 6.1% in the last twelve months. If earnings continue to decline at that rate the company may have increasing difficulty managing its debt load. The balance sheet is clearly the area to focus on when you are analysing debt. But ultimately the future profitability of the business will decide if Kunlun Energy can strengthen its balance sheet over time. So if you want to see what the professionals think, you might find this free report on analyst profit forecasts to be interesting.
But our final consideration is also important, because a company cannot pay debt with paper profits; it needs cold hard cash. While Kunlun Energy has net cash on its balance sheet, it's still worth taking a look at its ability to convert earnings before interest and tax (EBIT) to free cash flow, to help us understand how quickly it is building (or eroding) that cash balance. Over the most recent three years, Kunlun Energy recorded free cash flow worth 64% of its EBIT, which is around normal, given free cash flow excludes interest and tax. This cold hard cash means it can reduce its debt when it wants to.
Summing Up
We could understand if investors are concerned about Kunlun Energy's liabilities, but we can be reassured by the fact it has has net cash of CN¥23.2b. So we don't think Kunlun Energy's use of debt is risky. When analysing debt levels, the balance sheet is the obvious place to start. However, not all investment risk resides within the balance sheet - far from it. Case in point: We've spotted 1 warning sign for Kunlun Energy you should be aware of.
At the end of the day, it's often better to focus on companies that are free from net debt. You can access our special list of such companies (all with a track record of profit growth). It's free.
Have feedback on this article? Concerned about the content? Get in touch with us directly. Alternatively, email editorial-team (at) simplywallst.com.
This article by Simply Wall St is general in nature. We provide commentary based on historical data and analyst forecasts only using an unbiased methodology and our articles are not intended to be financial advice. It does not constitute a recommendation to buy or sell any stock, and does not take account of your objectives, or your financial situation. We aim to bring you long-term focused analysis driven by fundamental data. Note that our analysis may not factor in the latest price-sensitive company announcements or qualitative material. Simply Wall St has no position in any stocks mentioned.