
 Nasdaq
 華爾街日報
華爾街日報Has TJX Run Too Far After Its 152% Five Year Rally?
- If you are wondering whether TJX Companies is still a bargain after such a strong run, or if buying at today's price would simply mean chasing performance, you are not alone. That is exactly what we are going to unpack.
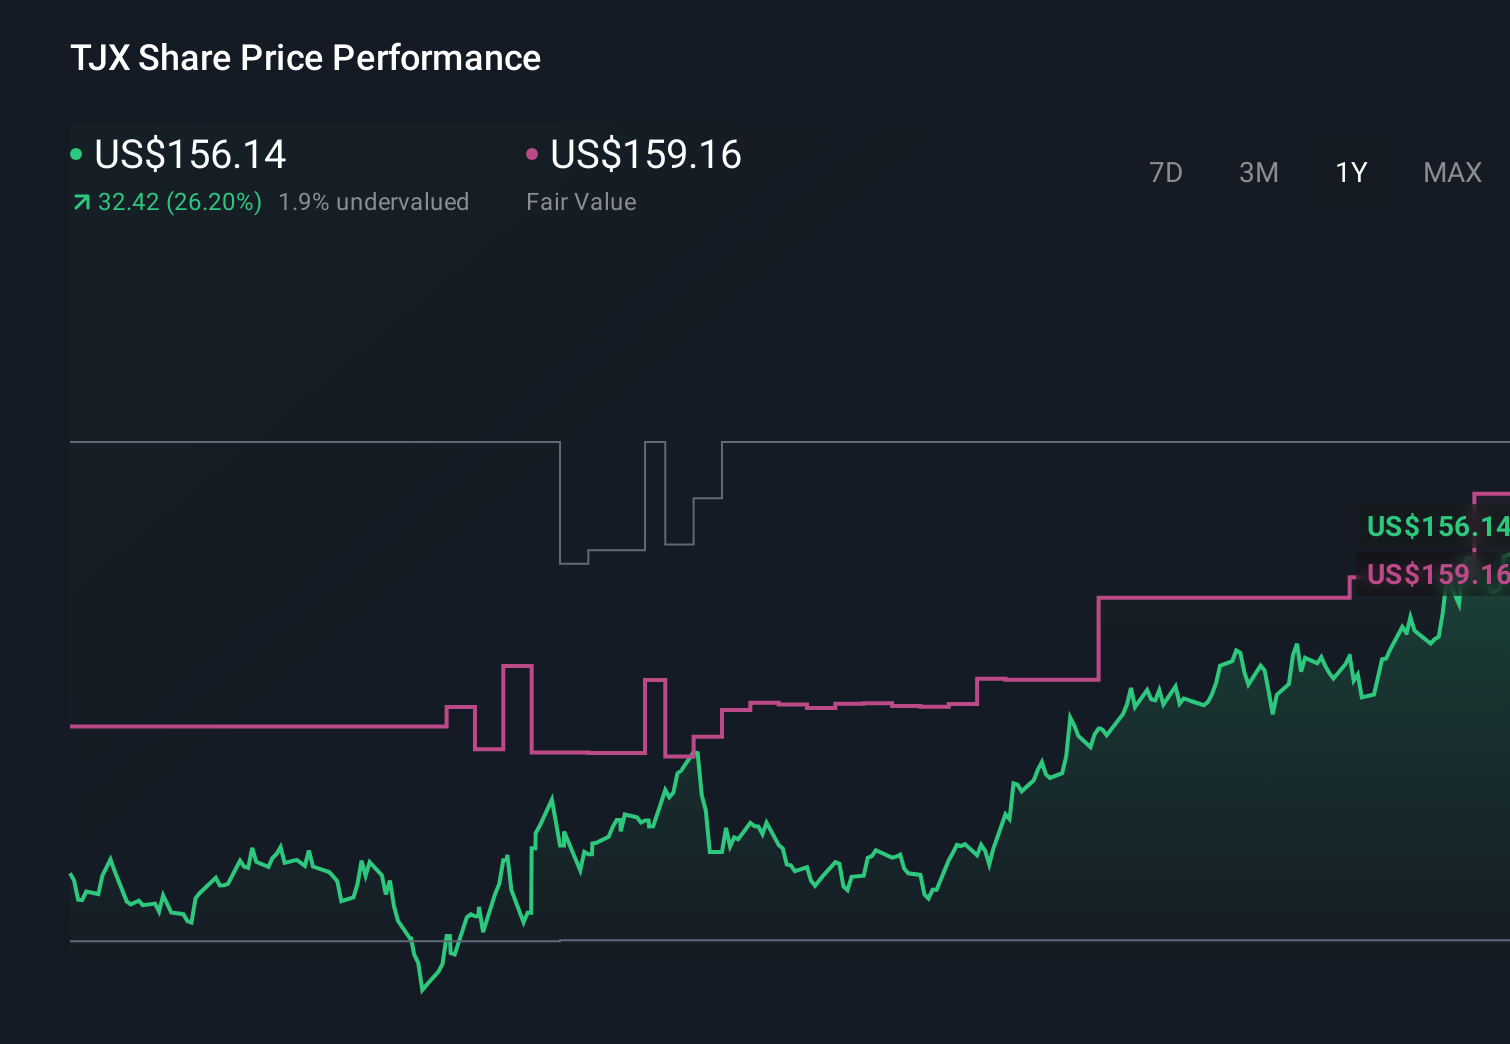
- The stock has quietly kept compounding, up about 2.0% over the last week, 7.3% over the last month, 29.4% year to date, and a hefty 152.0% over five years. This naturally raises the question of how much upside is left from here.
- Those gains have been supported by a steady drumbeat of positive sentiment around off-price retail and TJX's ability to pull shoppers in even as consumers stay cautious. At the same time, analysts and investors have been rotating into more resilient, cash-generative names, which has helped push TJX higher as a perceived quality play in the retail space.
- Despite that strength, TJX scores just 0/6 on our basic undervaluation checks, suggesting the market may already be pricing in a lot of good news. Next, we will walk through different valuation approaches and, towards the end of the article, look at a more nuanced way to think about what this stock may really be worth.
TJX Companies scores just 0/6 on our valuation checks. See what other red flags we found in the full valuation breakdown.
Approach 1: TJX Companies Discounted Cash Flow (DCF) Analysis
A Discounted Cash Flow model estimates what a business is worth by projecting how much cash it can generate in the future, then discounting those cash flows back to today to account for risk and the time value of money.
For TJX Companies, the latest twelve month Free Cash Flow is about $4.5 billion. Analysts expect this to grow steadily, with projections reaching around $6.6 billion of Free Cash Flow by 2030, and then continuing to climb modestly thereafter. Only the first few years are based on analyst forecasts, while the later years are extrapolated using Simply Wall St's growth assumptions.
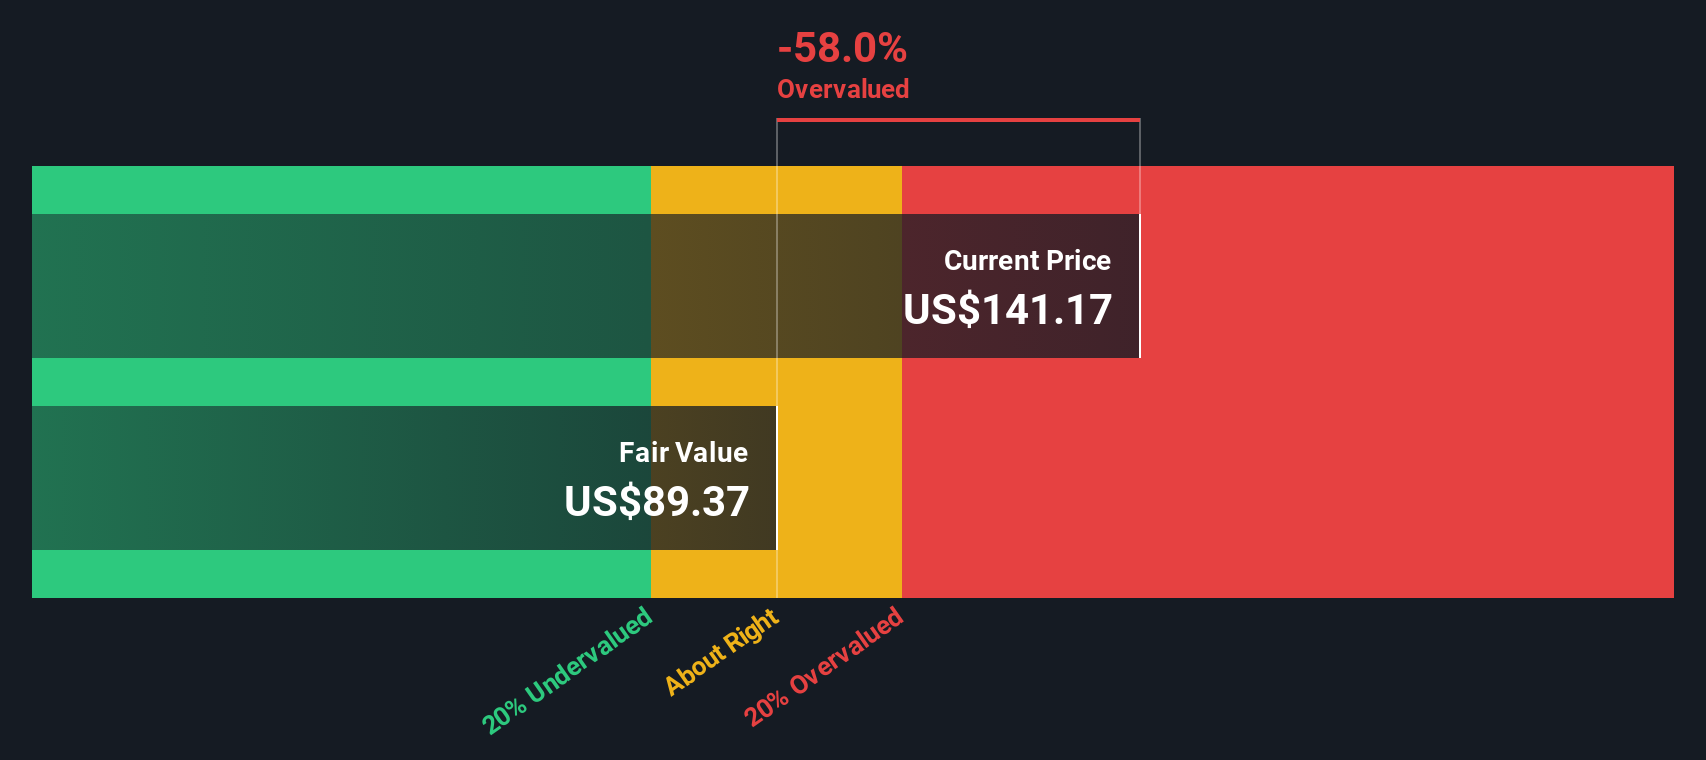
When all of these future cash flows are discounted back to today in a 2 Stage Free Cash Flow to Equity model, the estimated intrinsic value comes out at roughly $98.94 per share. Compared with the current market price, the DCF suggests TJX is about 58.4% overvalued, which indicates that a lot of future growth and quality is already reflected in the stock.
Result: OVERVALUED
Our Discounted Cash Flow (DCF) analysis suggests TJX Companies may be overvalued by 58.4%. Discover 913 undervalued stocks or create your own screener to find better value opportunities.
Approach 2: TJX Companies Price vs Earnings
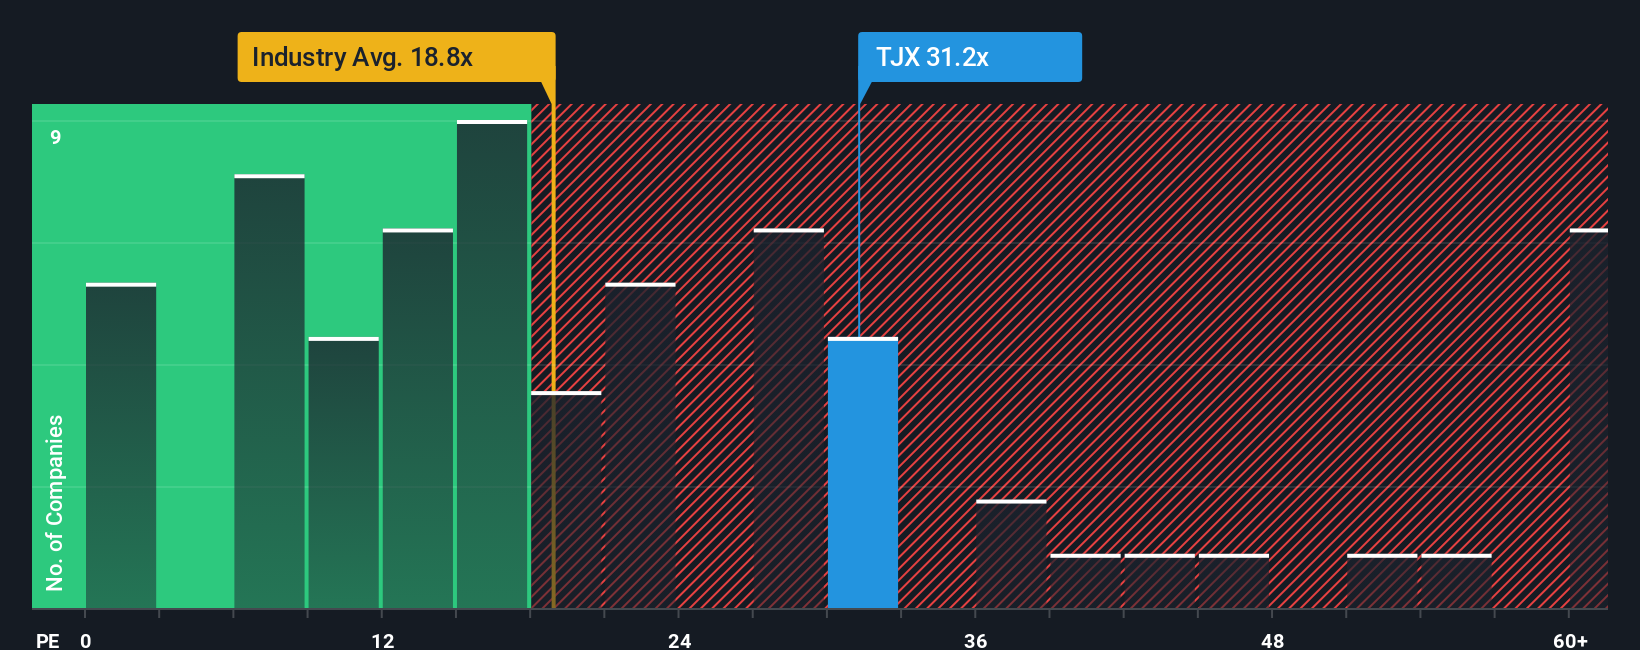
For a consistently profitable business like TJX Companies, the Price to Earnings ratio is a useful way to gauge how much investors are willing to pay for each dollar of current earnings. In general, faster growth and lower perceived risk justify a higher PE, while slower growth or more uncertainty should mean a lower, more conservative multiple.
TJX currently trades on a PE of about 34.0x, which is noticeably higher than both the Specialty Retail industry average of around 20.3x and the peer group average of roughly 21.3x. On the surface, that premium suggests investors are assigning TJX a quality and growth halo relative to its sector.
Simply Wall St's Fair Ratio framework goes a step further by estimating what PE a company should trade on after considering its earnings growth outlook, profitability, risk profile, industry, and market capitalization. For TJX, that Fair Ratio is around 22.2x, which is well below the current 34.0x. Because this approach adjusts for company specific strengths and risks, it offers a more tailored benchmark than simple peer or industry comparisons, and it implies TJX is trading on a richer multiple than its fundamentals alone would warrant.
Result: OVERVALUED
PE ratios tell one story, but what if the real opportunity lies elsewhere? Discover 1455 companies where insiders are betting big on explosive growth.
Upgrade Your Decision Making: Choose your TJX Companies Narrative
Earlier we mentioned that there is an even better way to understand valuation, so let us introduce you to Narratives, a simple way to attach your own story about TJX Companies to the numbers by connecting your assumptions for revenue, earnings, margins and fair value into one coherent view. This view lives on the Simply Wall St Community page and updates dynamically when new information like earnings or news lands. It helps you quickly see whether your fair value still sits above the current share price, which might support a buy stance, or has dropped below it, which might argue for trimming or waiting. For example, one investor on the platform may build a bullish TJX Narrative with faster revenue growth, higher margins and a fair value near the top end of analyst targets around $181 per share. Another might take a more cautious stance with slower growth, more modest margins and a fair value closer to the lower end of the range near $88 to $90 per share. This illustrates how different perspectives can be compared and tracked in one place.
Do you think there's more to the story for TJX Companies? Head over to our Community to see what others are saying!
This article by Simply Wall St is general in nature. We provide commentary based on historical data and analyst forecasts only using an unbiased methodology and our articles are not intended to be financial advice. It does not constitute a recommendation to buy or sell any stock, and does not take account of your objectives, or your financial situation. We aim to bring you long-term focused analysis driven by fundamental data. Note that our analysis may not factor in the latest price-sensitive company announcements or qualitative material. Simply Wall St has no position in any stocks mentioned.
Have feedback on this article? Concerned about the content? Get in touch with us directly. Alternatively, email editorial-team@simplywallst.com