
 Nasdaq
 華爾街日報
華爾街日報Tokyo Base (TSE:3415) TTM EPS Surge Reinforces Bullish Profitability Narrative
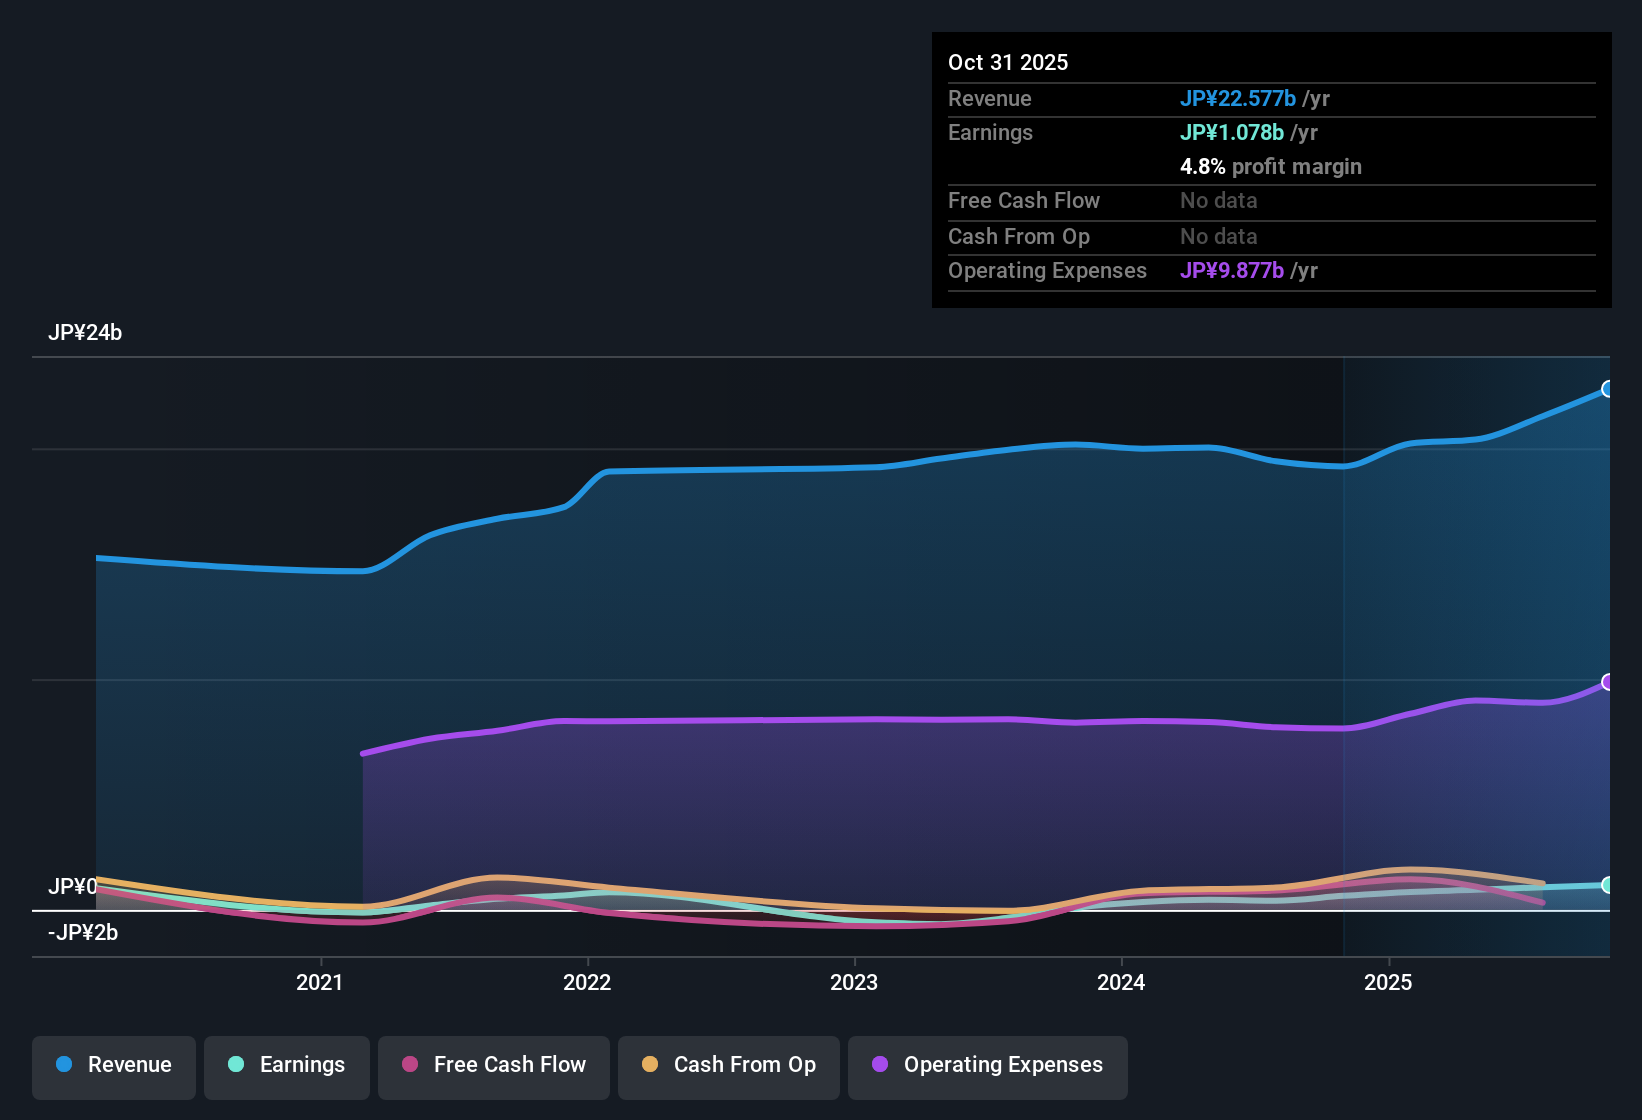
TOKYO BASELtd (TSE:3415) has posted its Q3 2026 numbers, with revenue at ¥5.6 billion and EPS of ¥2.92, while trailing twelve month revenue reached ¥22.6 billion and EPS came in at ¥24.82, underscoring a notable 77.7% year over year earnings uplift over the last year. The company has seen quarterly revenue move from ¥5.5 billion in Q3 2025 to ¥5.6 billion in Q3 2026, alongside EPS stepping down from ¥6.03 to ¥2.92 on a quarterly basis and stepping up from ¥13.72 to ¥24.82 on a trailing twelve month basis. This may encourage investors to look more closely at how far the recent margin gains can stretch.
See our full analysis for TOKYO BASELtd.With the headline figures on the table, the next step is to line these results up against the most widely held narratives about TOKYO BASELtd, highlighting where the numbers echo the story and where they start to push back.
Curious how numbers become stories that shape markets? Explore Community Narratives
TTM Net Profit Margin Lifts To 4.8%
- Over the last twelve months, net profit margin improved from 3.2% to 4.8%, with net income rising from ¥606 million to ¥1,077 million on revenue moving from ¥19,217 million to ¥22,576 million.
- Consensus narrative notes a bullish tilt around improving profitability, and those views are strongly grounded in these margin gains:
- The 77.7% year over year earnings growth, alongside the 4.8% trailing margin, shows more profit being kept from each yen of sales than a year ago.
- A five year earnings growth rate of 27.8% per year, together with the higher margin, suggests the recent uplift is part of a longer running profitability trend rather than a one off spike.
LTM EPS Climbs To ¥24.82
- Trailing twelve month EPS increased from ¥13.72 in the year to Q3 2025 to ¥24.82 in the year to Q3 2026, while TTM net income moved from ¥606 million to ¥1,077 million on revenue increasing from ¥19,217 million to ¥22,576 million.
- What is striking for the bullish narrative is how broadly the EPS figures back up the growth story:
- Alongside 77.7% year over year earnings growth and a five year compound earnings growth rate of 27.8% per year, the step up in TTM EPS to ¥24.82 shows that profit growth is not just a single quarter phenomenon.
- Analysts also forecast earnings to grow about 16.6% per year and revenue around 9% per year, which, on top of the recent TTM EPS rise, supports the idea that the business is set up for further profit expansion.
Premium 17x P/E Versus 20.8% DCF Discount
- The shares change hands at a trailing P/E of 17 times, above peer and industry averages of 15.2 times and 14.6 times, yet the current price of ¥421 sits about 20.8% below a DCF fair value estimate of ¥531.52.
- Critics highlight a bearish angle that the stock looks expensive versus peers, and the valuation data cuts both ways:
- The higher 17 times trailing P/E relative to the 15.2 times peer average supports the view that investors are paying a premium multiple compared with similar companies.
- At the same time, the DCF fair value of ¥531.52 being above the ¥421 share price, together with forecast earnings growth of 16.6% per year, challenges a simple bearish claim that the stock is unambiguously overpriced.
Next Steps
Don't just look at this quarter; the real story is in the long-term trend. We've done an in-depth analysis on TOKYO BASELtd's growth and its valuation to see if today's price is a bargain. Add the company to your watchlist or portfolio now so you don't miss the next big move.
Explore Alternatives
Despite impressive margin and EPS momentum, TOKYO BASELtd carries a premium valuation multiple that leaves less room for error if growth or sentiment cools.
If paying up for a stock on rich multiples makes you uneasy, use our these 907 undervalued stocks based on cash flows to quickly hunt for companies where price still lags underlying cash flow strength.
This article by Simply Wall St is general in nature. We provide commentary based on historical data and analyst forecasts only using an unbiased methodology and our articles are not intended to be financial advice. It does not constitute a recommendation to buy or sell any stock, and does not take account of your objectives, or your financial situation. We aim to bring you long-term focused analysis driven by fundamental data. Note that our analysis may not factor in the latest price-sensitive company announcements or qualitative material. Simply Wall St has no position in any stocks mentioned.
Have feedback on this article? Concerned about the content? Get in touch with us directly. Alternatively, email editorial-team@simplywallst.com