
 Nasdaq
 華爾街日報
華爾街日報Does Vestas Wind Systems Still Offer Upside After Its 80.1% One Year Surge?
- Wondering if Vestas Wind Systems is still worth buying after its huge run up, or if you have already missed the best of the upside? You are in the right place if you want a clear view on what the current price really implies.
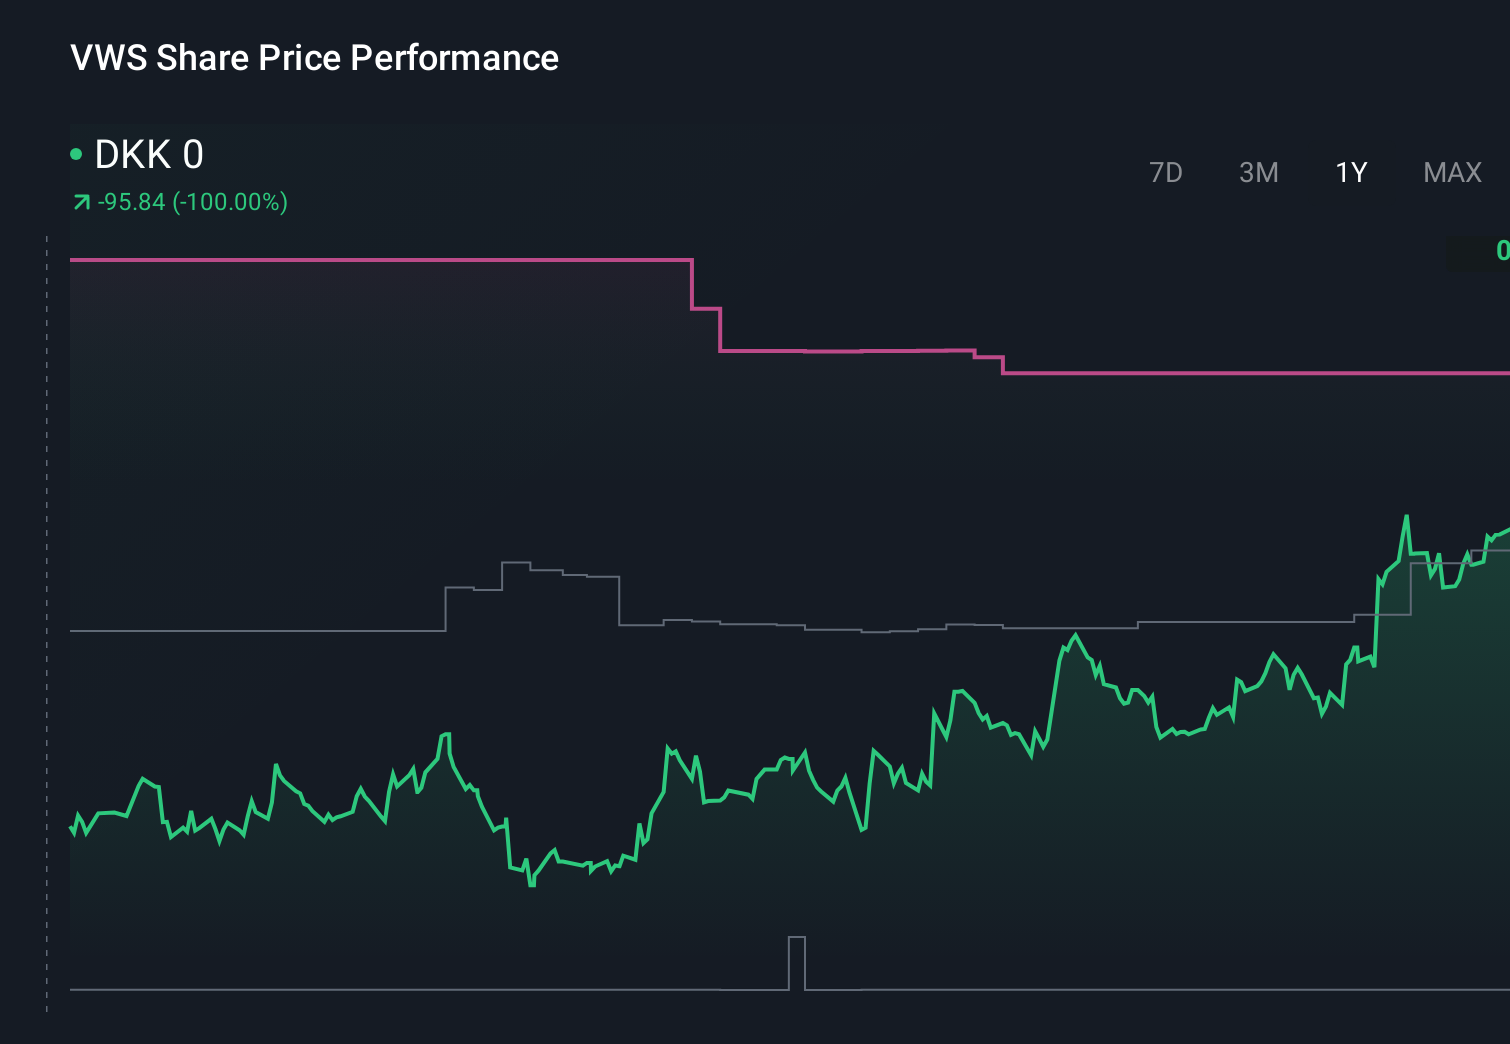
- Vestas has quietly staged a big comeback, with the share price up 6.5% over the last week, 10.2% over the past month, and a striking 63.8% year to date, translating into an 80.1% gain over the last year despite still being down over 3 and 5 years.
- Part of this momentum reflects renewed optimism around large offshore and onshore wind projects globally, as governments double down on energy transition targets and auction volumes pick up again. At the same time, headlines around easing supply chain bottlenecks and a more rational pricing environment in wind tenders have helped investors reassess the risk profile of turbine manufacturers like Vestas.
- Even after this rally, Vestas only scores a 2/6 valuation check. This suggests that on traditional metrics it looks undervalued in some areas but not across the board. Next we will unpack those different valuation approaches before circling back to a more powerful way to think about what the market is really pricing in.
Vestas Wind Systems scores just 2/6 on our valuation checks. See what other red flags we found in the full valuation breakdown.
Approach 1: Vestas Wind Systems Discounted Cash Flow (DCF) Analysis
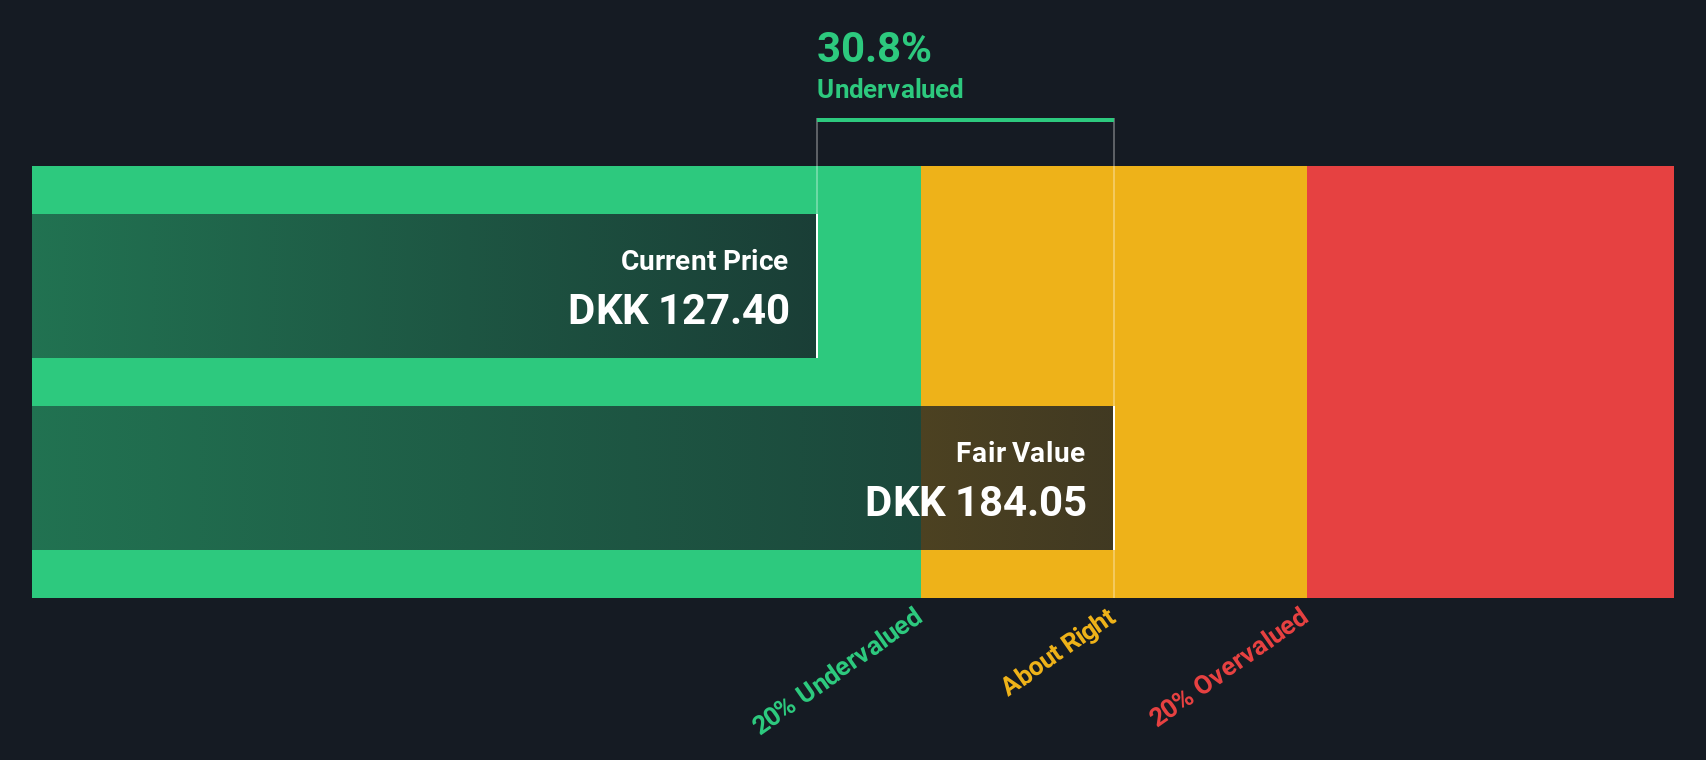
A Discounted Cash Flow, or DCF, model estimates what a business is worth by projecting its future cash flows and discounting them back to today, to reflect risk and the time value of money.
For Vestas Wind Systems, the latest twelve month free cash flow stands at about €1.97 billion. Analysts and internal estimates see free cash flow easing to roughly €1.24 billion by 2029, with a gradual, slower growth trajectory thereafter as the business matures. Simply Wall St uses a two stage free cash flow to equity model, where the first years rely on analyst forecasts and the later years are extrapolated to reflect more modest, long run growth.
Putting these projections together, the model arrives at an intrinsic value of about DKK 165.73 per share. That is roughly 3.5% below the current market price, implying that this estimate is slightly below the current valuation but not by a wide margin.
Result: ABOUT RIGHT
Vestas Wind Systems is fairly valued according to our Discounted Cash Flow (DCF), but this can change at a moment's notice. Track the value in your watchlist or portfolio and be alerted on when to act.
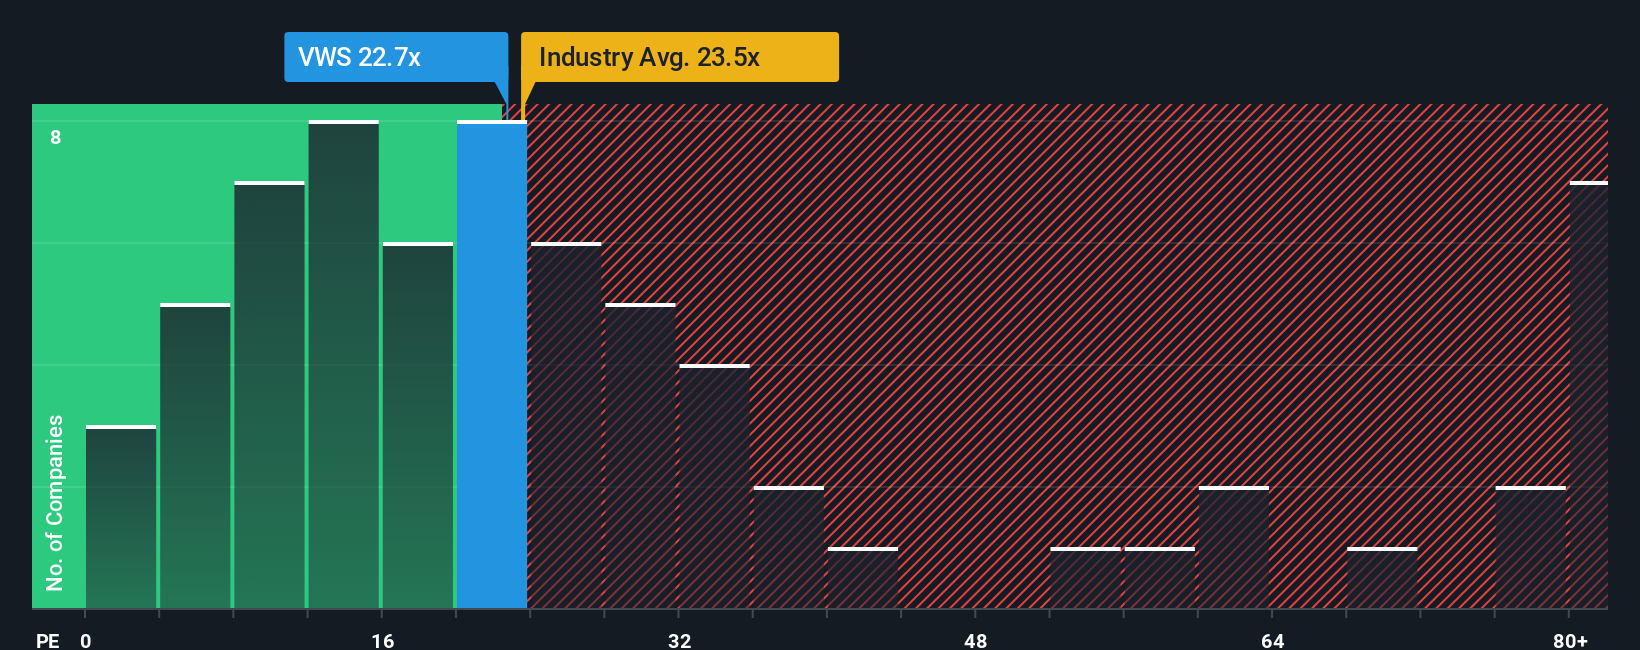
Approach 2: Vestas Wind Systems Price vs Earnings
Price to earnings, or PE, is a useful yardstick for profitable companies like Vestas because it links what investors pay today directly to the profits the business is already generating. In general, stronger and more reliable earnings growth, combined with lower risk, justifies a higher, or more expensive, PE ratio, while slower growth or higher uncertainty should be reflected in a lower multiple.
Vestas currently trades on about 24.34x earnings, which is a discount to the broader Electrical industry at roughly 29.89x and also below the peer group average of around 27.28x. To move beyond simple comparisons, Simply Wall St calculates a proprietary Fair Ratio, which estimates what Vestas PE should be once you factor in its earnings growth outlook, profitability, size, sector and risk profile. For Vestas, this Fair Ratio is 27.16x.
This Fair Ratio is more informative than a plain peer or industry comparison because it adjusts for the specific mix of growth, margins, business risks and market cap that make Vestas different from other wind and electrical equipment players. With the shares at 24.34x compared to a Fair Ratio of 27.16x, the current valuation points to the stock still trading at a modest discount to what its fundamentals would justify.
Result: UNDERVALUED
PE ratios tell one story, but what if the real opportunity lies elsewhere? Discover 1448 companies where insiders are betting big on explosive growth.
Upgrade Your Decision Making: Choose your Vestas Wind Systems Narrative
Earlier we mentioned that there is an even better way to understand valuation, so let us introduce you to Narratives, a simple way to connect your view of a company with the numbers behind its fair value.
A Narrative is your story for a stock, spelling out how you think revenue, earnings and margins will evolve and then linking that story to a financial forecast and a resulting fair value estimate.
On Simply Wall St, Narratives are an easy, accessible tool within the Community page used by millions of investors, helping you compare your assumed fair value to today’s share price so you can decide whether Vestas is a buy, hold, or sell.
Because Narratives are dynamically updated as new information arrives, like earnings results, policy changes or major project wins, your fair value view automatically stays in sync with the latest developments.
For example, one Vestas Narrative might assume strong policy support and improving margins, and assign a fair value close to DKK195.99. A more cautious Narrative that emphasizes policy risk, pricing pressure and offshore execution challenges could land nearer DKK60, and seeing where your own view sits between those extremes can guide your next move.
Do you think there's more to the story for Vestas Wind Systems? Head over to our Community to see what others are saying!
This article by Simply Wall St is general in nature. We provide commentary based on historical data and analyst forecasts only using an unbiased methodology and our articles are not intended to be financial advice. It does not constitute a recommendation to buy or sell any stock, and does not take account of your objectives, or your financial situation. We aim to bring you long-term focused analysis driven by fundamental data. Note that our analysis may not factor in the latest price-sensitive company announcements or qualitative material. Simply Wall St has no position in any stocks mentioned.
Have feedback on this article? Concerned about the content? Get in touch with us directly. Alternatively, email editorial-team@simplywallst.com