
 Nasdaq
 華爾街日報
華爾街日報Does OPKO Health’s Recent Rebound Signal a Mispriced Opportunity in 2025?
- Wondering if OPKO Health at around $1.35 is a bargain hiding in plain sight or a classic value trap? This breakdown will walk you through what the numbers are really saying about the stock.
- Despite being down 6.9% year to date and 16.1% over the last year, the share price has edged up 5.5% in the last month even as 5-year returns remain a steep 70.4% lower. This mix hints at shifting sentiment rather than a clear trend.
- Recently, OPKO has stayed on investors' radars as it continues to position its diagnostics and therapeutics pipeline in a competitive healthcare space, with partnerships and product updates drawing selective attention. Broader sector moves in healthcare and biotech have also fed into renewed trading interest, adding volatility without yet changing the long term story.
- Right now OPKO only scores a 2/6 on our valuation checks, suggesting it screens as undervalued on a couple of fronts but not across the board. Next we will break down those valuation methods in detail and then finish with a more holistic way to think about what the stock might really be worth.
OPKO Health scores just 2/6 on our valuation checks. See what other red flags we found in the full valuation breakdown.
Approach 1: OPKO Health Discounted Cash Flow (DCF) Analysis
A Discounted Cash Flow model takes OPKO Health's expected future cash flows and discounts them back to today's dollars, aiming to estimate what the business is worth right now based on those projections.
OPKO is currently generating negative Free Cash Flow, around $213.6 Million in the last twelve months, which highlights that the business is still in an investment and scaling phase. Analyst forecasts, combined with Simply Wall St's extrapolations, suggest this could change meaningfully over time, with Free Cash Flow projected to reach about $242.9 Million in 10 years, supported by a mix of near term losses and steadily improving cash generation through 2035.
When these projected cash flows are discounted back using a 2 Stage Free Cash Flow to Equity model, the intrinsic value is estimated at roughly $5.06 per share. Compared with a current share price around $1.35, the model implies the stock is about 73.3% undervalued, which indicates a wide theoretical margin of safety if those cash flow improvements materialize.
Result: UNDERVALUED
Our Discounted Cash Flow (DCF) analysis suggests OPKO Health is undervalued by 73.3%. Track this in your watchlist or portfolio, or discover 907 more undervalued stocks based on cash flows.

Approach 2: OPKO Health Price vs Sales
For companies that are not yet consistently profitable, like OPKO Health, the Price to Sales ratio is often a more reliable gauge of value than earnings-based metrics because it focuses on revenue traction rather than volatile or negative earnings.
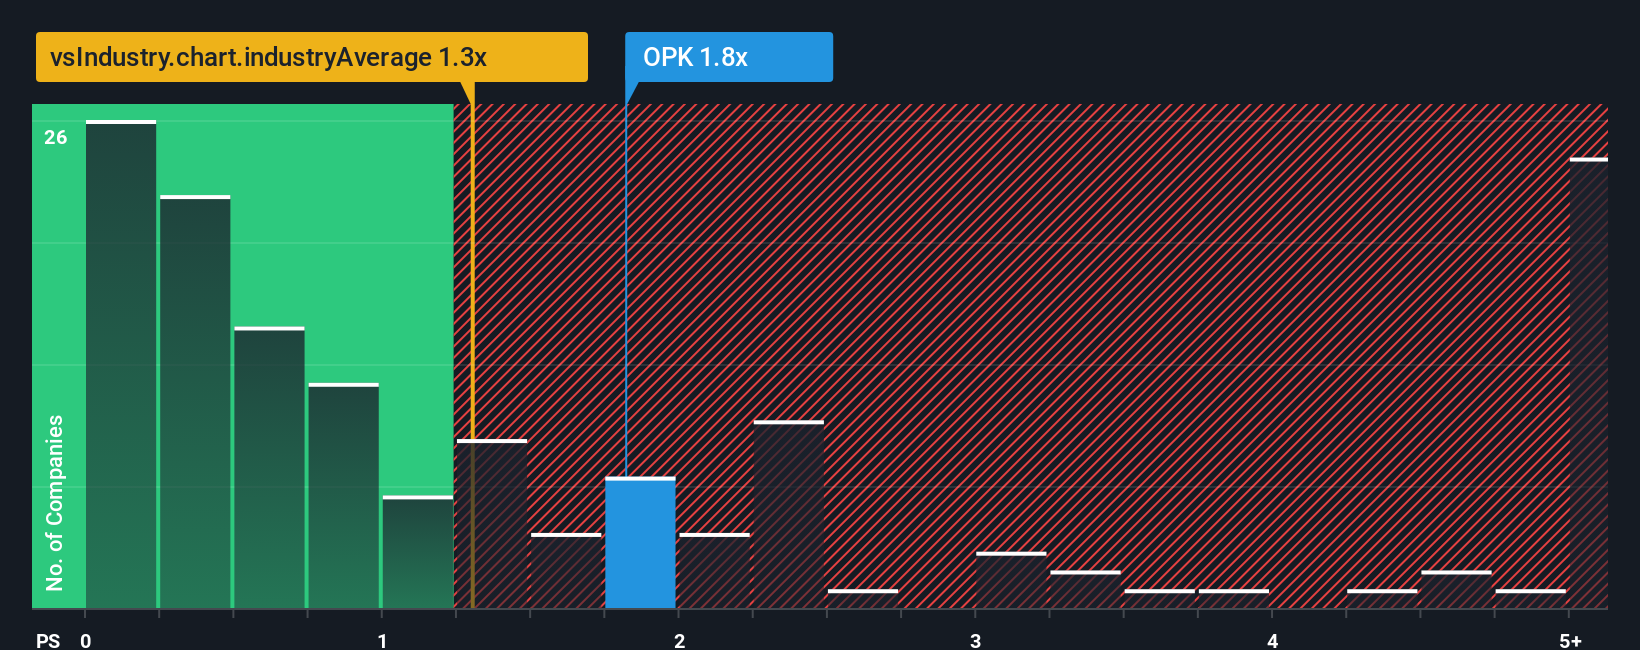
In general, higher growth and lower risk justify paying a higher multiple, while slower growth or elevated risk usually call for a discount to a sector's typical valuation range. OPKO currently trades on a Price to Sales ratio of about 1.61x, compared with the broader Healthcare industry average of roughly 1.33x and a peer group average near 1.40x. This suggests the market is already paying a modest premium relative to many comparables.
Simply Wall St's Fair Ratio framework estimates what a "normal" Price to Sales multiple should be for OPKO, given its growth outlook, margins, risk profile, size and industry, and arrives at a Fair Ratio of around 0.45x. This stock-specific benchmark is more informative than a simple peer or industry comparison because it adjusts for OPKO's weaker profitability and riskier profile. Since the current 1.61x multiple sits well above the 0.45x Fair Ratio, the shares screen as stretched on a sales-based valuation.
Result: OVERVALUED
PS ratios tell one story, but what if the real opportunity lies elsewhere? Discover 1448 companies where insiders are betting big on explosive growth.
Upgrade Your Decision Making: Choose your OPKO Health Narrative
Earlier we mentioned that there is an even better way to understand valuation, so let's introduce you to Narratives. These are simply your own story about a company that connects your view of its products, strategy and risks to a concrete forecast for revenue, earnings and margins, and finally to a fair value you can compare with today’s price.
On Simply Wall St, Narratives live in the Community page and are designed to be easy and accessible. They help you turn your expectations for OPKO Health's diagnostics growth, partnerships and profitability into numbers that automatically roll into a valuation, so you can quickly see how your Fair Value compares with the current market price.
Because Narratives on the platform are updated dynamically when new information arrives, such as earnings, guidance changes or FDA news, your fair value for OPKO Health adjusts alongside the story. You can also see how other investors frame the same facts, from more cautious views that cluster closer to the low end of recent analyst targets near $2.00 per share to optimistic perspectives that lean toward the high end around $8.50 per share.
Do you think there's more to the story for OPKO Health? Head over to our Community to see what others are saying!

This article by Simply Wall St is general in nature. We provide commentary based on historical data and analyst forecasts only using an unbiased methodology and our articles are not intended to be financial advice. It does not constitute a recommendation to buy or sell any stock, and does not take account of your objectives, or your financial situation. We aim to bring you long-term focused analysis driven by fundamental data. Note that our analysis may not factor in the latest price-sensitive company announcements or qualitative material. Simply Wall St has no position in any stocks mentioned.
Have feedback on this article? Concerned about the content? Get in touch with us directly. Alternatively, email editorial-team@simplywallst.com