
 Nasdaq
 華爾街日報
華爾街日報Under Armour (UAA): Reassessing Valuation After Share Price Slide and Ongoing Restructuring Efforts
Under Armour (UAA) has been grinding through a tough stretch, with the share price sliding over the past year even as annual revenue inches higher, leaving investors debating whether this is value or value trap territory.
See our latest analysis for Under Armour.
Recent restructuring efforts and cautious consumer spending have weighed on sentiment, and the roughly 47% year to date share price return, alongside a 50% one year total shareholder return decline, signals fading momentum despite modest underlying revenue growth.
If you are reassessing your consumer and retail exposure, it can be useful to compare what you see here with automakers by exploring auto manufacturers.
With shares trading well below analyst targets despite improving earnings momentum, investors are left to ask: Is Under Armour quietly undervalued here, or is the current price already baking in all the growth ahead?
Most Popular Narrative: 26.7% Undervalued
With the most followed narrative placing fair value above the recent 4.30 dollar close, the gap between current price and expected recovery is hard to ignore.
The ongoing transformation to a brand first strategy, with a focus on premiumization, tighter SKU assortments, and greater brand storytelling, positions Under Armour to increase average selling prices, improve full price sell through, and reduce reliance on discounting, which should positively impact net margins and long term earnings growth.
Curious what kind of margin rebuild, revenue trajectory, and future earnings multiple are baked into that upside case, and how long the turnaround runway really is?
Result: Fair Value of $5.87 (UNDERVALUED)
Have a read of the narrative in full and understand what's behind the forecasts.
However, persistent tariff-driven margin pressure and ongoing weakness in key wholesale and footwear channels could easily derail the margin recovery story.
Find out about the key risks to this Under Armour narrative.
Another Angle on Value
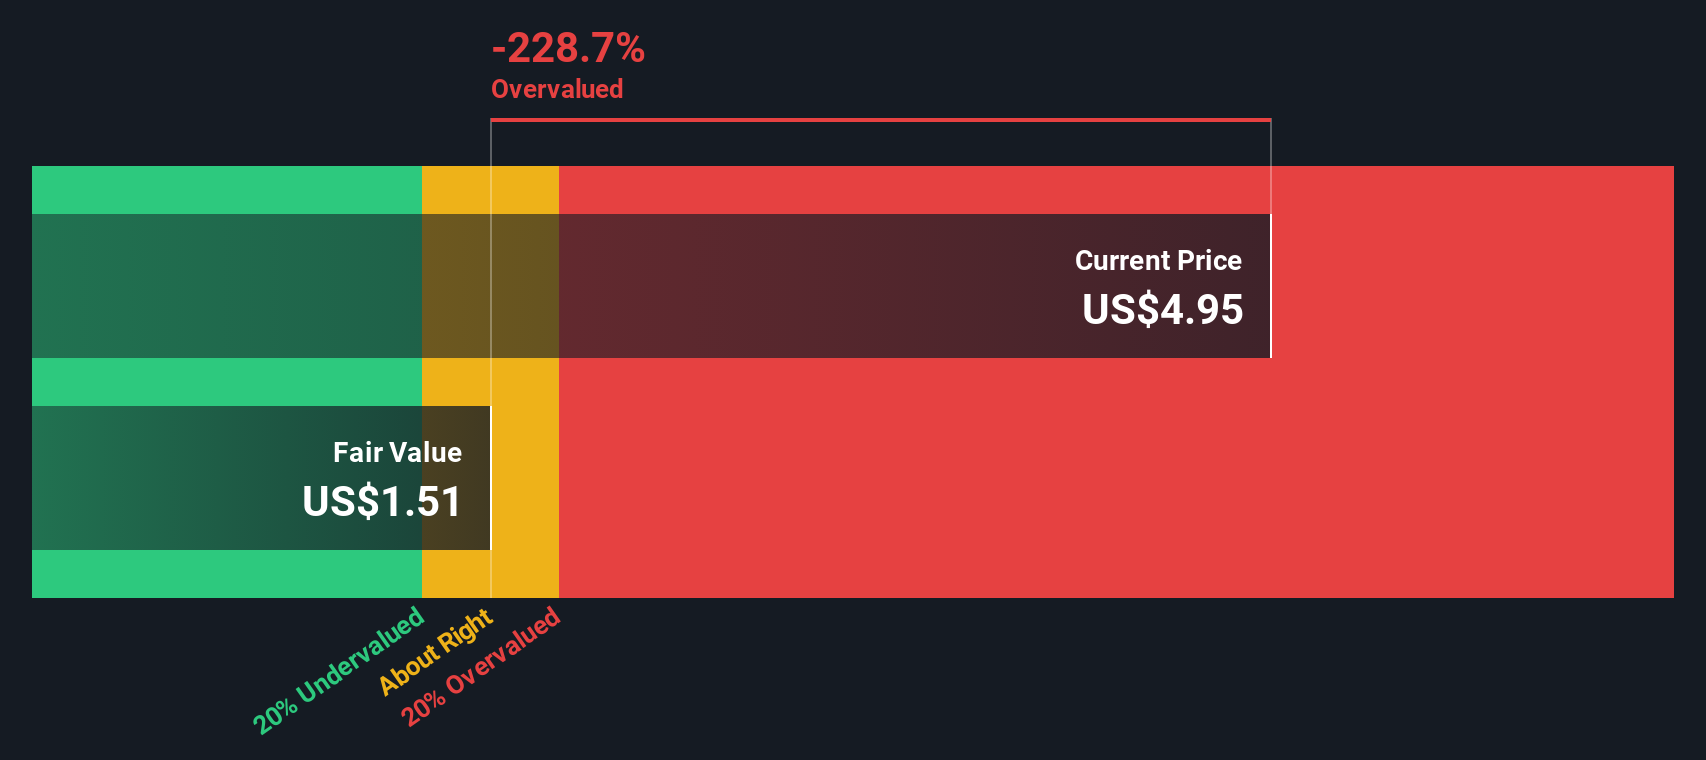
Our SWS DCF model paints a very different picture, suggesting fair value closer to 1.08 dollars per share, which would make Under Armour look meaningfully overvalued at current levels. That gap versus the upbeat narrative forces a tougher question: are long term hopes outrunning cash flow reality?
Look into how the SWS DCF model arrives at its fair value.
Simply Wall St performs a discounted cash flow (DCF) on every stock in the world every day (check out Under Armour for example). We show the entire calculation in full. You can track the result in your watchlist or portfolio and be alerted when this changes, or use our stock screener to discover 903 undervalued stocks based on their cash flows. If you save a screener we even alert you when new companies match - so you never miss a potential opportunity.
Build Your Own Under Armour Narrative
If this view does not quite line up with your own, or you prefer to dig into the numbers yourself, you can build a personalized narrative in just a few minutes, Do it your way.
A great starting point for your Under Armour research is our analysis highlighting 2 key rewards and 1 important warning sign that could impact your investment decision.
Ready for your next investment move?
Before you move on, consider using the Simply Wall St Screener to help identify your next idea so you are not leaving potential high conviction opportunities on the table.
- Identify potential mispriced opportunities early by scanning these 903 undervalued stocks based on cash flows that pair solid fundamentals with valuations grounded in future cash flows.
- Explore the frontier of innovation by targeting these 28 quantum computing stocks that are pushing boundaries in computing power, security, and real world problem solving.
- Support your income stream by focusing on these 13 dividend stocks with yields > 3% that combine regular payouts with sustainable balance sheets.
This article by Simply Wall St is general in nature. We provide commentary based on historical data and analyst forecasts only using an unbiased methodology and our articles are not intended to be financial advice. It does not constitute a recommendation to buy or sell any stock, and does not take account of your objectives, or your financial situation. We aim to bring you long-term focused analysis driven by fundamental data. Note that our analysis may not factor in the latest price-sensitive company announcements or qualitative material. Simply Wall St has no position in any stocks mentioned.
Have feedback on this article? Concerned about the content? Get in touch with us directly. Alternatively, email editorial-team@simplywallst.com