
 Nasdaq
 華爾街日報
華爾街日報Assessing Fifth Third After Its Strong 2025 Rally and Solid Profitability Metrics
- If you are wondering whether Fifth Third Bancorp is still good value after its recent run up, or if you have missed the boat, you are in the right place to unpack what the current share price really implies.
- The stock has climbed 5.9% over the last week, 12.4% over the past month, and is now up 13.4% year to date, adding to an impressive 114.1% gain over five years that has clearly reshaped investor expectations.
- Recent attention on regional banks, tighter capital and liquidity standards, and ongoing debates around interest rate cuts have all kept sentiment toward lenders like Fifth Third in the spotlight, with investors rethinking how resilient their balance sheets really are. At the same time, regulatory updates on stress testing and capital buffers, along with management moves to streamline operations and strengthen digital banking capabilities, have added fuel to the conversation about the bank's long term profitability profile.
- On our checks, Fifth Third Bancorp scores a 4/6 valuation score, suggesting it screens as undervalued on most, but not all, traditional metrics. Next, we will break that down across multiple valuation approaches before finishing with a more holistic way to decide what the stock is really worth.
Find out why Fifth Third Bancorp's 10.1% return over the last year is lagging behind its peers.
Approach 1: Fifth Third Bancorp Excess Returns Analysis
The Excess Returns model looks at how effectively a bank turns its shareholders equity into profits above its cost of capital, and then projects how long that value creation can continue.
For Fifth Third Bancorp, the starting point is a Book Value of $29.26 per share and an Average Return on Equity of 13.37%. Based on analysts forward looking assumptions, this translates into a Stable EPS of $4.58 per share, while the Stable Book Value is expected to rise to $34.23 per share over time. Against a Cost of Equity of $2.50 per share, the bank is generating an Excess Return of $2.07 per share, which is the economic profit this model capitalizes.
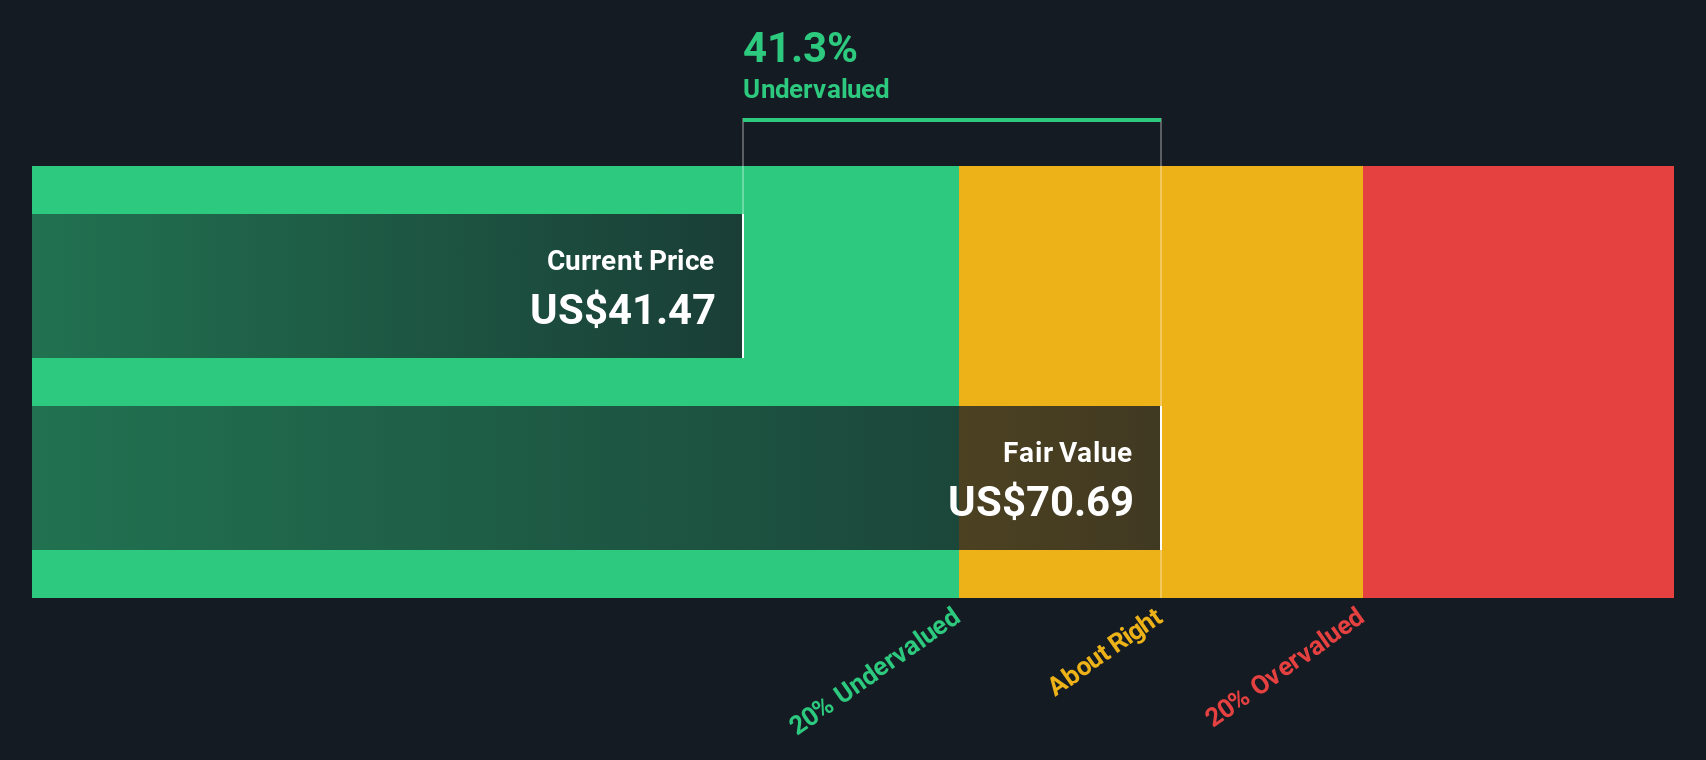
When these excess returns are projected and discounted, the model arrives at an intrinsic value of about $85.43 per share. Compared with the current market price, this implies the stock is roughly 44.0% undervalued, which indicates that investors may not be fully pricing in the bank profitability and balance sheet strength.
Result: UNDERVALUED
Our Excess Returns analysis suggests Fifth Third Bancorp is undervalued by 44.0%. Track this in your watchlist or portfolio, or discover 905 more undervalued stocks based on cash flows.
Approach 2: Fifth Third Bancorp Price vs Earnings
For a consistently profitable bank like Fifth Third, the price to earnings, or PE, ratio is a useful way to gauge how much investors are willing to pay for each dollar of current earnings. In general, companies with stronger growth prospects and lower perceived risk can justify a higher PE multiple, while slower growth or higher risk tends to cap what the market sees as a normal or fair PE range.
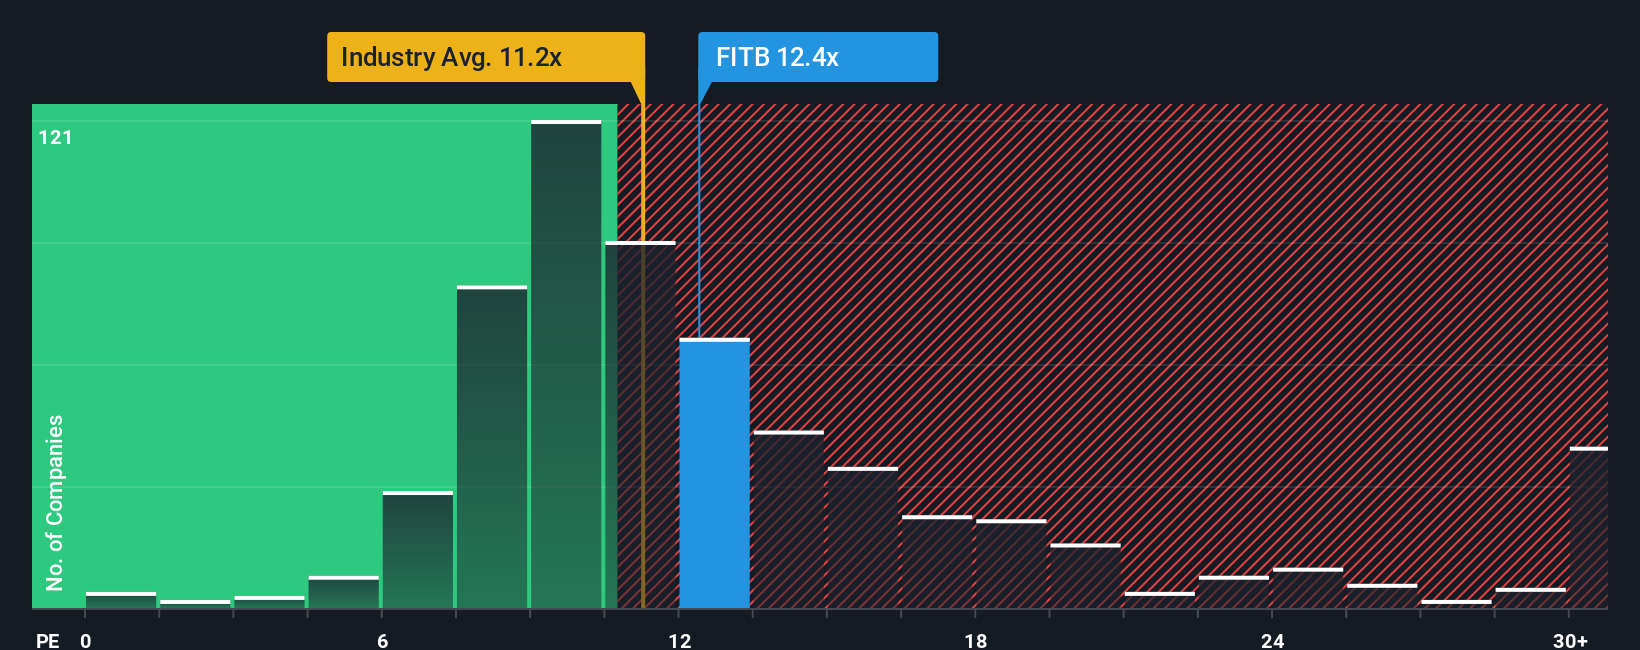
Fifth Third currently trades at about 14.0x earnings, which is above the broader Banks industry average of roughly 12.0x but slightly below the 15.1x average of its closest peers. Simply Wall St also calculates a Fair Ratio of 19.5x for Fifth Third, a proprietary estimate of what the PE should be given its earnings growth outlook, profitability, size, industry positioning, and risk profile.
This Fair Ratio is more tailored than a simple peer or industry comparison because it explicitly adjusts for factors like growth, margins, and risk, rather than assuming all banks deserve similar multiples. Since the Fair Ratio of 19.5x sits well above the current 14.0x, the PE lens suggests the stock still trades at a discount to what its fundamentals may warrant.
Result: UNDERVALUED
PE ratios tell one story, but what if the real opportunity lies elsewhere? Discover 1447 companies where insiders are betting big on explosive growth.
Upgrade Your Decision Making: Choose your Fifth Third Bancorp Narrative
Earlier we mentioned that there is an even better way to understand valuation, so let us introduce you to Narratives, a simple way to connect your view of Fifth Third Bancorp’s story to a set of financial forecasts and a fair value estimate that you can track over time.
A Narrative on Simply Wall St is your own story behind the numbers where you spell out what you think will happen to the bank revenue, earnings, and margins, and the platform converts that story into a forecast and a fair value that you can easily compare to today share price to help inform a decision on whether to buy, hold, or sell.
Hosted on the Community page used by millions of investors, Narratives are easy to set up, update automatically as new news or earnings arrive, and make it clear how different perspectives can coexist. For example, one investor might build a bullish Narrative for Fifth Third Bancorp with a fair value near $55.00 based on strong benefits from the Comerica merger and robust Southeast growth. Another more cautious investor might anchor a Narrative closer to $43.00, emphasizing competition, regulatory pressure, and integration risk. The platform keeps both views updated in real time so you can see where you sit on that spectrum.
Do you think there's more to the story for Fifth Third Bancorp? Head over to our Community to see what others are saying!

This article by Simply Wall St is general in nature. We provide commentary based on historical data and analyst forecasts only using an unbiased methodology and our articles are not intended to be financial advice. It does not constitute a recommendation to buy or sell any stock, and does not take account of your objectives, or your financial situation. We aim to bring you long-term focused analysis driven by fundamental data. Note that our analysis may not factor in the latest price-sensitive company announcements or qualitative material. Simply Wall St has no position in any stocks mentioned.
Have feedback on this article? Concerned about the content? Get in touch with us directly. Alternatively, email editorial-team@simplywallst.com