
 Nasdaq
 華爾街日報
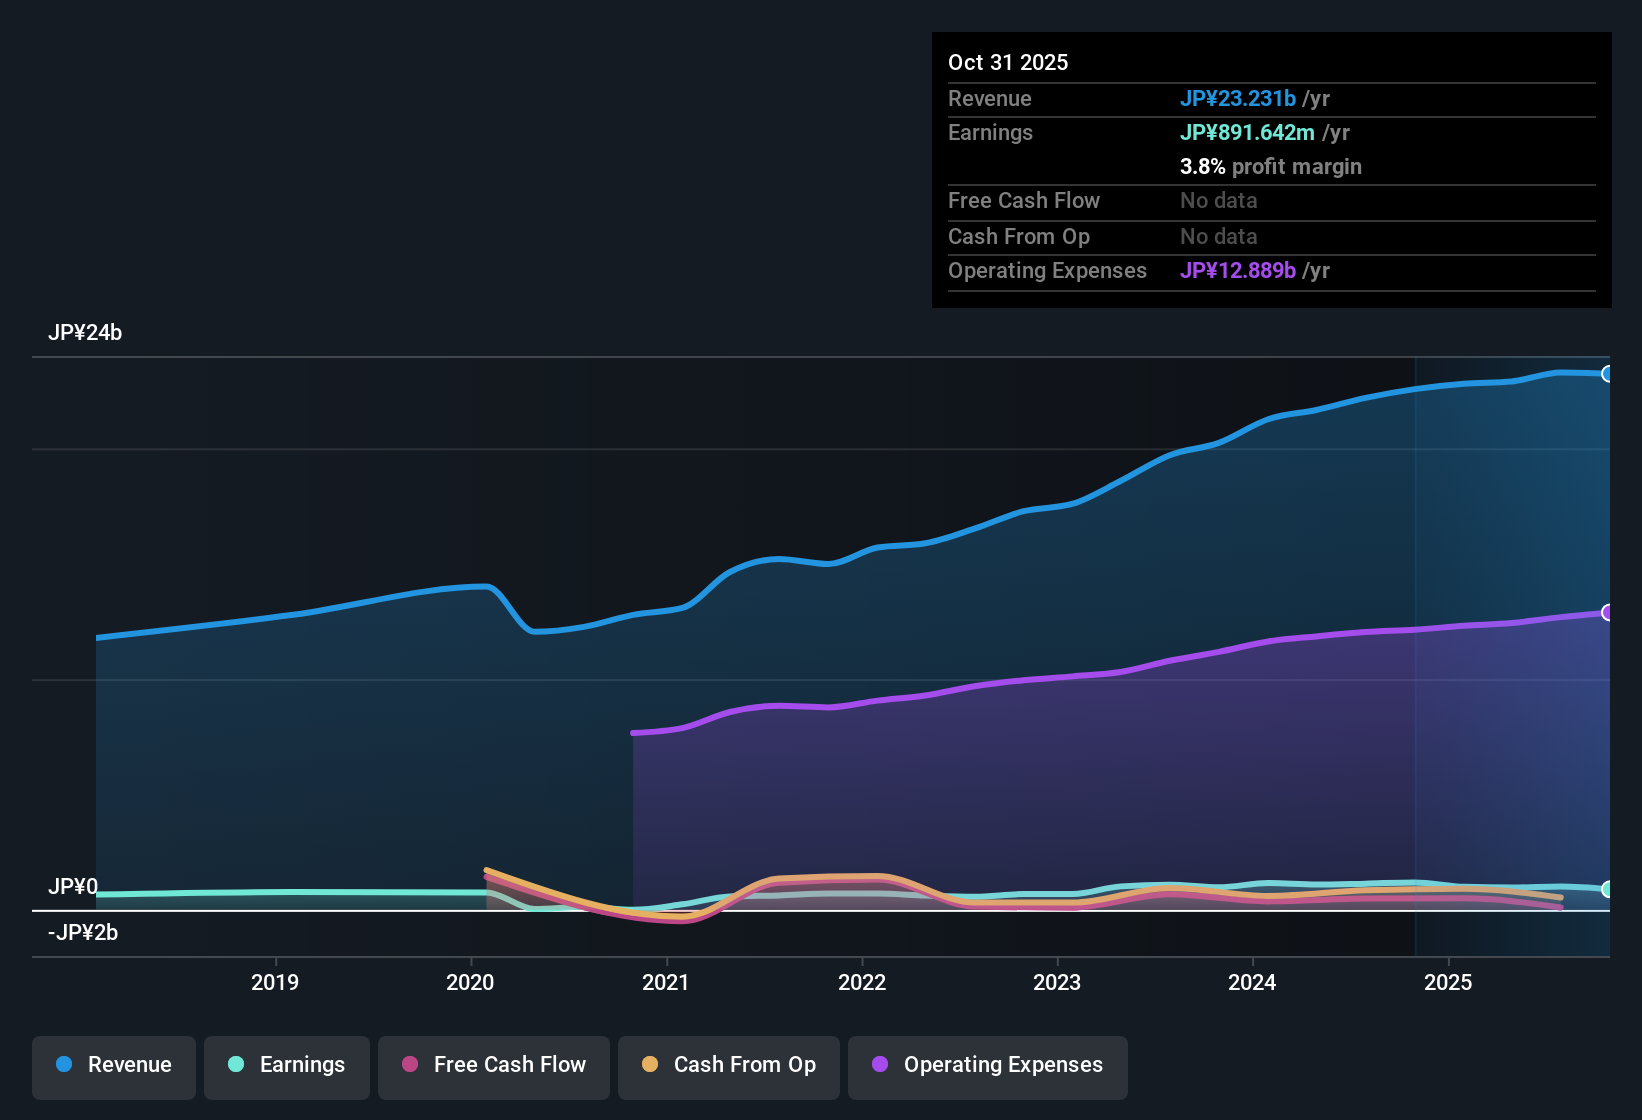
華爾街日報WA (TSE:7683) Margin Squeeze and Net Profit Drop Challenge Bullish Growth Narrative
WA (TSE:7683) has put out its Q3 2026 scorecard, reporting revenue of ¥5.1 billion and Basic EPS of ¥1.31, alongside trailing 12 month revenue of ¥23.2 billion and EPS of ¥46.76 that reflects a 20.1% annualized earnings growth rate over the past five years but a weaker most recent year. Over recent quarters the company has seen revenue move from ¥6.6 billion in Q2 2025 to ¥6.4 billion in Q4 2025 and then ¥7.0 billion in Q2 2026 before landing at ¥5.1 billion in Q3 2026, while net income excluding extra items shifted from ¥429 million to ¥383 million to ¥480 million and then ¥25 million. This has set up a results season where investors are focused squarely on how margins are holding up.
See our full analysis for WA.With the latest numbers on the table, the next step is to see how this margin story lines up with the dominant narratives around WA on Simply Wall St and where those stories might need a rethink.
Curious how numbers become stories that shape markets? Explore Community Narratives
Margins Squeezed as Net Profit Falls to ¥25 million
- Net income excluding extra items dropped to ¥25 million in Q3 2026 from ¥480 million in Q2 2026 and ¥383 million in Q4 2025, aligning with a trailing net profit margin of 3.8 percent compared with 5.3 percent a year earlier.
- Critics highlight that this weaker profitability challenges a straightforward bullish story built on past growth, because:
- Trailing 12 month net income has eased to ¥892 million from ¥1,015 million a quarter earlier, even though trailing revenue is roughly flat around ¥23.2 billion.
- The earlier five year annualized earnings growth of 20.1 percent now contrasts with the most recent year, where earnings moved negatively relative to that trend.
High Quality Earnings but Slowing 20.1 percent Growth Trend
- Over the last 12 months, Basic EPS of about ¥46.76 and net income of ¥892 million still sit on top of a five year earnings growth rate of 20.1 percent per year, even though the latest year no longer matches that pace.
- Supporters argue that this track record still leans bullish, but the data adds nuance:
- Trailing revenue has edged from ¥22.2 billion to about ¥23.2 billion over the past year, so the pressure on earnings is not coming from a collapse in sales but more from margin compression.
- Even with the recent slowdown, trailing earnings are described as high quality, which helps the bullish view that the business model remains fundamentally sound despite short term profit pressure.
Premium Valuation at 29.2x P/E Versus DCF
- The shares trade on a trailing P E of 29.2 times against peer and industry averages of 15.3 times and 14.6 times, while the current price of ¥1,365 sits well above the DCF fair value of roughly ¥163.95.
- Skeptical investors point to this as a bearish tilt in the story because:
- The valuation premium is appearing at the same time as trailing net margin has slipped from 5.3 percent to 3.8 percent, so the market is paying more while profitability is under pressure.
- With trailing net income at ¥892 million versus revenue of ¥23.2 billion, there is limited buffer if margins weaken again, which can make a high multiple more sensitive to any further disappointment.
Next Steps
Don't just look at this quarter; the real story is in the long-term trend. We've done an in-depth analysis on WA's growth and its valuation to see if today's price is a bargain. Add the company to your watchlist or portfolio now so you don't miss the next big move.
Explore Alternatives
WA is wrestling with shrinking margins, a sharp drop in quarterly net income, and a lofty valuation that leaves little room for further earnings disappointment.
If paying up for a pressured business makes you uneasy, use our these 906 undervalued stocks based on cash flows to quickly find companies where the price tag better reflects resilient profitability and long term potential.
This article by Simply Wall St is general in nature. We provide commentary based on historical data and analyst forecasts only using an unbiased methodology and our articles are not intended to be financial advice. It does not constitute a recommendation to buy or sell any stock, and does not take account of your objectives, or your financial situation. We aim to bring you long-term focused analysis driven by fundamental data. Note that our analysis may not factor in the latest price-sensitive company announcements or qualitative material. Simply Wall St has no position in any stocks mentioned.
Have feedback on this article? Concerned about the content? Get in touch with us directly. Alternatively, email editorial-team@simplywallst.com