
 Nasdaq
 華爾街日報
華爾街日報Assessing ImmunityBio (IBRX) Valuation After EMA Backs Anktiva for BCG‑Unresponsive Bladder Cancer
ImmunityBio (IBRX) just cleared a big regulatory hurdle in Europe, with the EMA recommending conditional marketing authorization for its bladder cancer therapy Anktiva plus BCG in BCG unresponsive non muscle invasive disease.
See our latest analysis for ImmunityBio.
The EMA recommendation has come after a volatile stretch for ImmunityBio, with a 1 month share price return of 6.73 percent but a 1 year total shareholder return of negative 21.55 percent. This suggests optimism is rebuilding from a weak longer term base, even as recent board changes and regulatory wins reset expectations.
If Anktiva's progress has you rethinking your healthcare exposure, this is also a good moment to scout other promising names via our curated healthcare stocks.
With ImmunityBio trading at 2.22 per share and analysts targeting 10.40, combined with rapid top line growth but deep losses, is the current price an overlooked entry point, or is it already baking in aggressive future gains?
Price-to-Sales of 26.5x, Is it justified?
ImmunityBio's shares last closed at 2.22, and that price equates to a rich 26.5 times trailing sales, far above many biotech peers.
The price to sales ratio compares the market value of the company to the revenue it currently generates, a common yardstick for early stage or loss making biotechs where profits are not yet available. For ImmunityBio, this elevated multiple implies investors are already assigning a premium to the potential of its immunotherapy platform and commercial ramp, rather than its current financials.
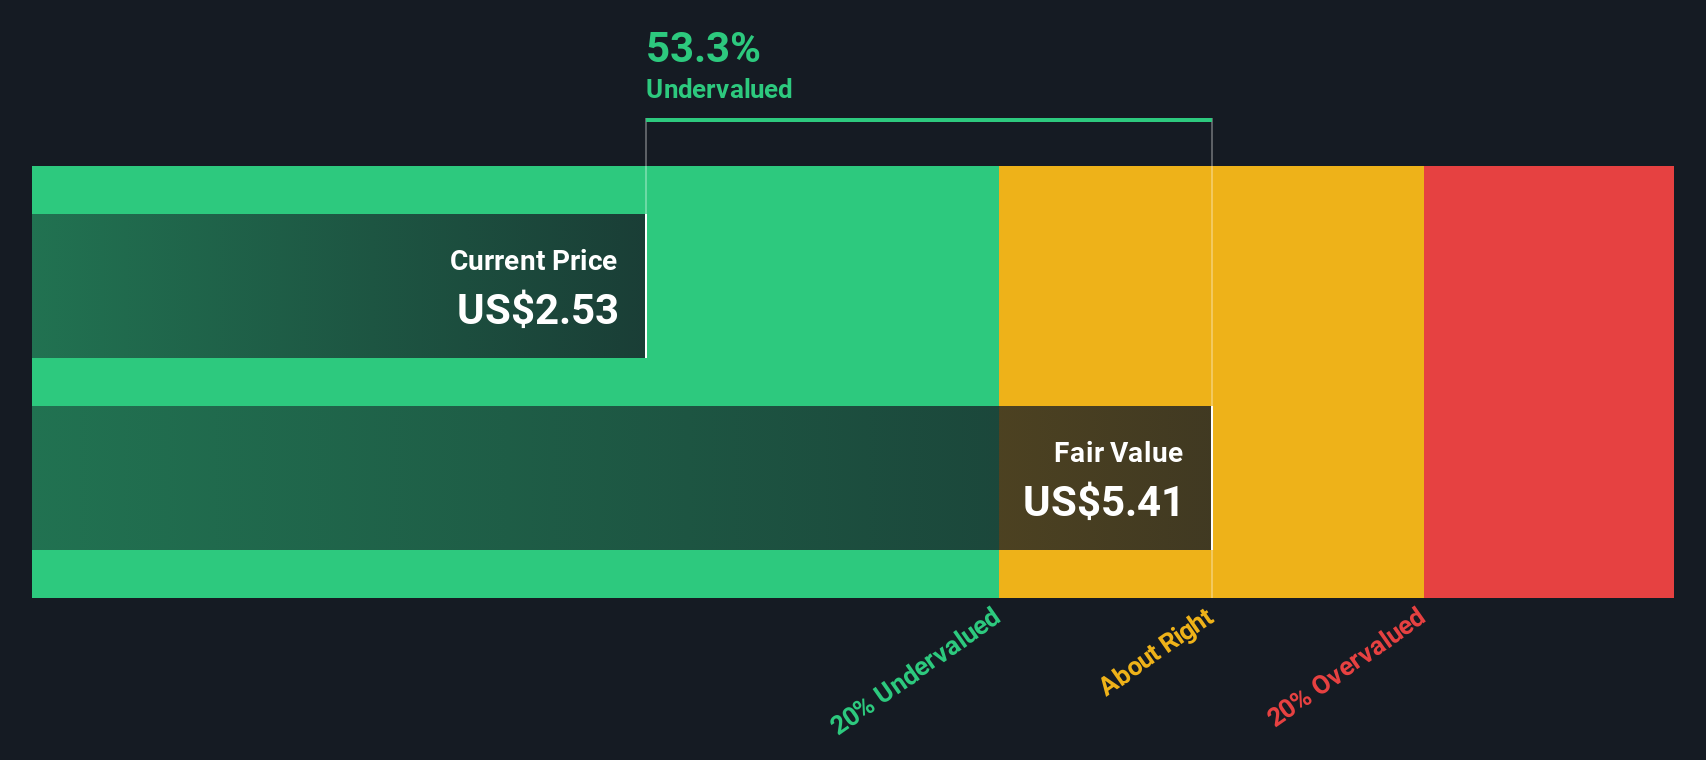
There is a clear tension in the numbers. The stock screens as good value versus our estimated fair value and fair price to sales ratio, yet it still looks expensive relative to other biotechs. The SWS DCF model points to a fair value of 6.33 per share. This means the current 2.22 price reflects a discount of around 65 percent, while the fair price to sales ratio is estimated at 32.1 times, above today's 26.5 times level.
Against the wider US Biotechs industry, the premium is stark. ImmunityBio's price to sales ratio of 26.5 times stands well above the sector average of 12 times, and also exceeds a peer group average of 16.7 times. If the market were to move closer to the 32.1 times fair ratio implied by our model, that re-rating could support further upside, but it also highlights how much future growth is already reflected in today's valuation.
Explore the SWS fair ratio for ImmunityBio
Result: Price to sales of 26.5x (ABOUT RIGHT)
However, steep ongoing losses and a long, uncertain path to broader commercialization could quickly sap sentiment if clinical or regulatory timelines slip.
Find out about the key risks to this ImmunityBio narrative.
Another View on Value
Our DCF model offers a different perspective from the rich 26.5 times sales multiple. It puts fair value near 6.33 dollars per share, which suggests that ImmunityBio could be materially undervalued at 2.22. Is the market underestimating future cash flows or overestimating the risks?
Look into how the SWS DCF model arrives at its fair value.
Simply Wall St performs a discounted cash flow (DCF) on every stock in the world every day (check out ImmunityBio for example). We show the entire calculation in full. You can track the result in your watchlist or portfolio and be alerted when this changes, or use our stock screener to discover 906 undervalued stocks based on their cash flows. If you save a screener we even alert you when new companies match - so you never miss a potential opportunity.
Build Your Own ImmunityBio Narrative
If you would rather dig into the numbers yourself and stress test different assumptions, you can build a custom view in minutes: Do it your way.
A great starting point for your ImmunityBio research is our analysis highlighting 2 key rewards and 3 important warning signs that could impact your investment decision.
Ready for your next investing move?
Before the market prices in the next wave of opportunities, put your research edge to work with targeted stock ideas filtered by real fundamentals and momentum.
- Capture potential mispricings by scanning these 906 undervalued stocks based on cash flows where strong cash flows and subdued valuations can set up attractive upside.
- Position ahead of transformative trends by targeting innovation leaders through these 26 AI penny stocks that are reshaping how industries use data and automation.
- Strengthen your income strategy by reviewing these 13 dividend stocks with yields > 3% that combine meaningful yields with the balance sheets needed to sustain payouts.
This article by Simply Wall St is general in nature. We provide commentary based on historical data and analyst forecasts only using an unbiased methodology and our articles are not intended to be financial advice. It does not constitute a recommendation to buy or sell any stock, and does not take account of your objectives, or your financial situation. We aim to bring you long-term focused analysis driven by fundamental data. Note that our analysis may not factor in the latest price-sensitive company announcements or qualitative material. Simply Wall St has no position in any stocks mentioned.
Have feedback on this article? Concerned about the content? Get in touch with us directly. Alternatively, email editorial-team@simplywallst.com