
 Nasdaq
 華爾街日報
華爾街日報Global Penny Stocks: 3 Picks With Market Caps Below US$2B
Global markets have been experiencing a mix of highs and lows, with major U.S. stock indexes reaching all-time highs amid the Federal Reserve's recent interest rate cuts, while concerns linger over technology valuations and labor market risks. In this context, penny stocks—traditionally seen as smaller or newer companies—continue to capture investor interest due to their potential for growth. Despite being considered a niche investment area today, these stocks can offer unique opportunities when supported by strong financials.
Top 10 Penny Stocks Globally
| Name | Share Price | Market Cap | Rewards & Risks |
| Lever Style (SEHK:1346) | HK$1.45 | HK$909.23M | ✅ 4 ⚠️ 1 View Analysis > |
| Foresight Group Holdings (LSE:FSG) | £4.145 | £475.52M | ✅ 5 ⚠️ 0 View Analysis > |
| TK Group (Holdings) (SEHK:2283) | HK$2.55 | HK$2.12B | ✅ 4 ⚠️ 1 View Analysis > |
| Angler Gaming (NGM:ANGL) | SEK3.60 | SEK269.95M | ✅ 4 ⚠️ 2 View Analysis > |
| CNMC Goldmine Holdings (Catalist:5TP) | SGD1.10 | SGD445.82M | ✅ 4 ⚠️ 1 View Analysis > |
| Yangzijiang Shipbuilding (Holdings) (SGX:BS6) | SGD3.50 | SGD13.77B | ✅ 5 ⚠️ 1 View Analysis > |
| Integrated Diagnostics Holdings (LSE:IDHC) | $0.6325 | $367.69M | ✅ 4 ⚠️ 2 View Analysis > |
| RGB International Bhd (KLSE:RGB) | MYR0.215 | MYR331.28M | ✅ 4 ⚠️ 3 View Analysis > |
| EDU Holdings (ASX:EDU) | A$0.95 | A$136.74M | ✅ 4 ⚠️ 3 View Analysis > |
| Begbies Traynor Group (AIM:BEG) | £1.10 | £177.02M | ✅ 6 ⚠️ 1 View Analysis > |
Click here to see the full list of 3,616 stocks from our Global Penny Stocks screener.
Let's uncover some gems from our specialized screener.
XJ International Holdings (SEHK:1765)
Simply Wall St Financial Health Rating: ★★★★★☆
Overview: XJ International Holdings Co., Ltd. is an investment holding company that provides higher education and secondary vocational education services in China and Malaysia, with a market cap of HK$1.60 billion.
Operations: The company generates revenue from two main segments: Domestic Education, contributing CN¥3.38 billion, and Global Education, contributing CN¥645.46 million.
Market Cap: HK$1.6B
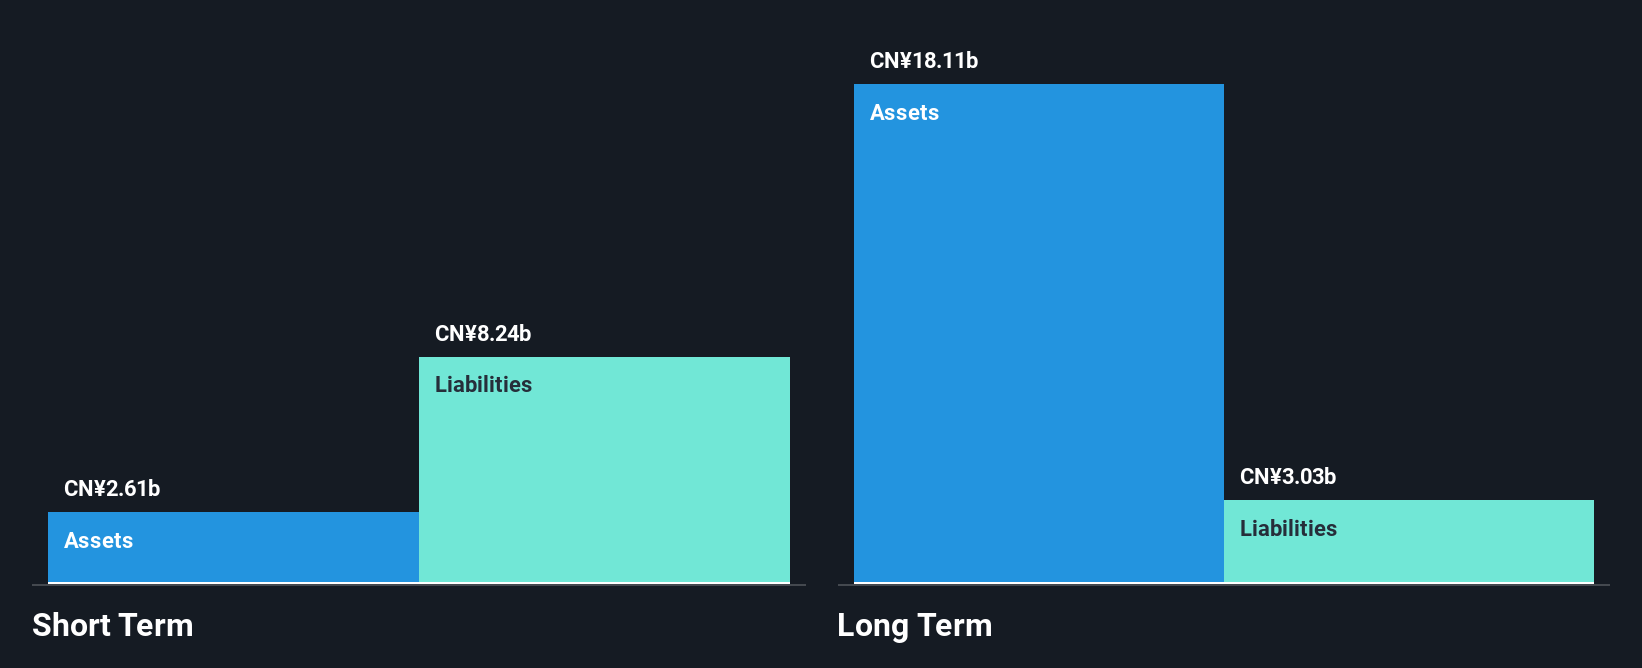
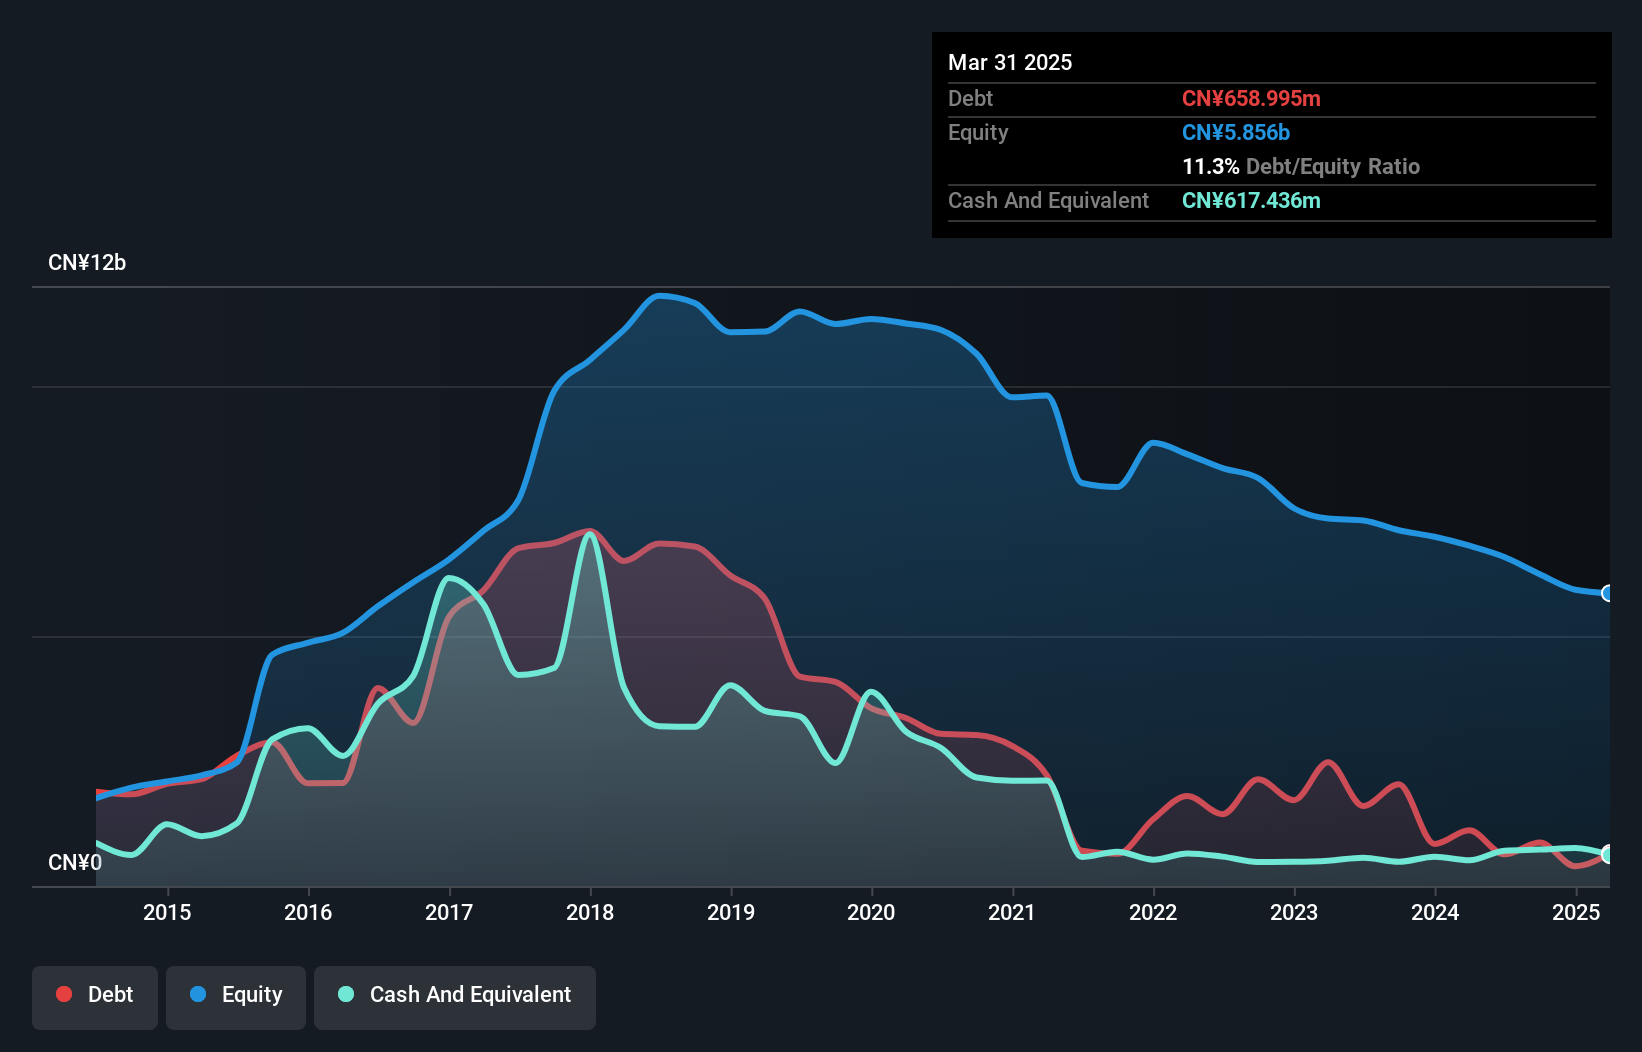
XJ International Holdings has shown a decline in net income, reporting CN¥384.78 million for the year ended August 31, 2025, down from CN¥609.56 million the previous year. Despite this decrease, the company's debt is well-managed with operating cash flow covering 32.7% of its debt and a satisfactory net debt to equity ratio of 16.1%. However, profit margins have decreased from 16.3% to 9.7%, partly due to large one-off items impacting results. The management team is experienced with an average tenure of 3.8 years but faces challenges with short-term liabilities exceeding short-term assets by CN¥2.7 billion.
- Click to explore a detailed breakdown of our findings in XJ International Holdings' financial health report.
- Review our growth performance report to gain insights into XJ International Holdings' future.
Yunnan Yunwei (SHSE:600725)
Simply Wall St Financial Health Rating: ★★★★★★
Overview: Yunnan Yunwei Company Limited is involved in the production and operation of coal coke and chemical products in China, with a market cap of CN¥4.47 billion.
Operations: The company's revenue is derived entirely from its operations in China, totaling CN¥650.46 million.
Market Cap: CN¥4.47B
Yunnan Yunwei Company Limited, with a market cap of CN¥4.47 billion, operates in China's coal coke and chemical sectors. The company reported sales of CN¥442.74 million for the first nine months of 2025, down from CN¥550.82 million the previous year, alongside a net loss increase to CN¥17.32 million from CN¥9.11 million last year. Despite being debt-free and having sufficient cash runway for over three years based on current free cash flow, Yunnan Yunwei remains unprofitable with declining earnings over five years and an inexperienced management team averaging 1.9 years in tenure, potentially impacting strategic direction and operational efficiency.
- Jump into the full analysis health report here for a deeper understanding of Yunnan Yunwei.
- Review our historical performance report to gain insights into Yunnan Yunwei's track record.

Beijing Haixin Energy TechnologyLtd (SZSE:300072)
Simply Wall St Financial Health Rating: ★★★★☆☆
Overview: Beijing Haixin Energy Technology Co., Ltd. operates in the energy technology sector and has a market cap of CN¥10.71 billion.
Operations: The company has not reported any specific revenue segments.
Market Cap: CN¥10.71B
Beijing Haixin Energy Technology Co., Ltd. has shown signs of financial improvement with sales reaching CN¥1.94 billion for the nine months ending September 2025, up from CN¥1.84 billion the previous year, and a shift to a net income of CN¥57.95 million from a significant loss previously. Although unprofitable over five years, it has consistently reduced losses by 13.1% annually and maintains satisfactory debt levels with short-term assets exceeding both short- and long-term liabilities significantly. However, its management team lacks experience, averaging only 1.9 years in tenure, which may affect strategic execution amidst high share price volatility.
- Unlock comprehensive insights into our analysis of Beijing Haixin Energy TechnologyLtd stock in this financial health report.
- Assess Beijing Haixin Energy TechnologyLtd's future earnings estimates with our detailed growth reports.
Key Takeaways
- Click through to start exploring the rest of the 3,613 Global Penny Stocks now.
- Interested In Other Possibilities? The end of cancer? These 29 emerging AI stocks are developing tech that will allow early idenification of life changing disesaes like cancer and Alzheimer's.
This article by Simply Wall St is general in nature. We provide commentary based on historical data and analyst forecasts only using an unbiased methodology and our articles are not intended to be financial advice. It does not constitute a recommendation to buy or sell any stock, and does not take account of your objectives, or your financial situation. We aim to bring you long-term focused analysis driven by fundamental data. Note that our analysis may not factor in the latest price-sensitive company announcements or qualitative material. Simply Wall St has no position in any stocks mentioned.
Have feedback on this article? Concerned about the content? Get in touch with us directly. Alternatively, email editorial-team@simplywallst.com