
 Nasdaq
 華爾街日報
華爾街日報European Penny Stocks To Watch: 3 Picks With Market Caps Over €50M
As European markets navigate a mixed landscape with varied performances across major indices, investors are looking for opportunities beyond the traditional blue-chip stocks. Penny stocks, often representing smaller or newer companies, continue to capture attention due to their affordability and potential for growth. Despite being an outdated term, these stocks can still offer compelling opportunities when backed by strong financial health.
Top 10 Penny Stocks In Europe
| Name | Share Price | Market Cap | Rewards & Risks |
| Orthex Oyj (HLSE:ORTHEX) | €4.62 | €82.05M | ✅ 4 ⚠️ 1 View Analysis > |
| Lucisano Media Group (BIT:LMG) | €1.02 | €15.15M | ✅ 4 ⚠️ 5 View Analysis > |
| DigiTouch (BIT:DGT) | €2.00 | €27.64M | ✅ 3 ⚠️ 1 View Analysis > |
| Angler Gaming (NGM:ANGL) | SEK3.60 | SEK269.95M | ✅ 4 ⚠️ 2 View Analysis > |
| Angler Gaming (DB:0QM) | €0.37 | €224.21M | ✅ 3 ⚠️ 3 View Analysis > |
| Libertas 7 (BME:LIB) | €3.10 | €65.75M | ✅ 3 ⚠️ 3 View Analysis > |
| ForFarmers (ENXTAM:FFARM) | €4.285 | €378.73M | ✅ 4 ⚠️ 1 View Analysis > |
| Nurminen Logistics Oyj (HLSE:NLG1V) | €0.92 | €74.24M | ✅ 2 ⚠️ 4 View Analysis > |
| Deceuninck (ENXTBR:DECB) | €2.26 | €312.38M | ✅ 3 ⚠️ 1 View Analysis > |
| Netgem (ENXTPA:ALNTG) | €0.78 | €26.12M | ✅ 2 ⚠️ 2 View Analysis > |
Click here to see the full list of 286 stocks from our European Penny Stocks screener.
Here we highlight a subset of our preferred stocks from the screener.
ELES Semiconductor Equipment (BIT:ELES)
Simply Wall St Financial Health Rating: ★★★★★☆
Overview: ELES Semiconductor Equipment S.p.A. designs, manufactures, and sells test equipment and solutions for the semiconductor industry both in Italy and internationally, with a market cap of €51.64 million.
Operations: The company generates €34.41 million in revenue from its Semiconductor Equipment and Services segment.
Market Cap: €51.64M
ELES Semiconductor Equipment, with a market cap of €51.64 million, is trading at good value compared to peers and the industry. Despite being unprofitable and experiencing increased losses over the past five years, its short-term assets comfortably cover both short- and long-term liabilities. The company's debt management shows improvement, with a reduced debt-to-equity ratio now at 46.7% over five years. However, interest payments are not well covered by EBIT (1.3x). Recent volatility in share price aligns with news of Mare Engineering Group's proposed acquisition for €26.8 million, expected to complete in January 2026.
- Get an in-depth perspective on ELES Semiconductor Equipment's performance by reading our balance sheet health report here.
- Examine ELES Semiconductor Equipment's earnings growth report to understand how analysts expect it to perform.

Verkkokauppa.com Oyj (HLSE:VERK)
Simply Wall St Financial Health Rating: ★★★★★☆
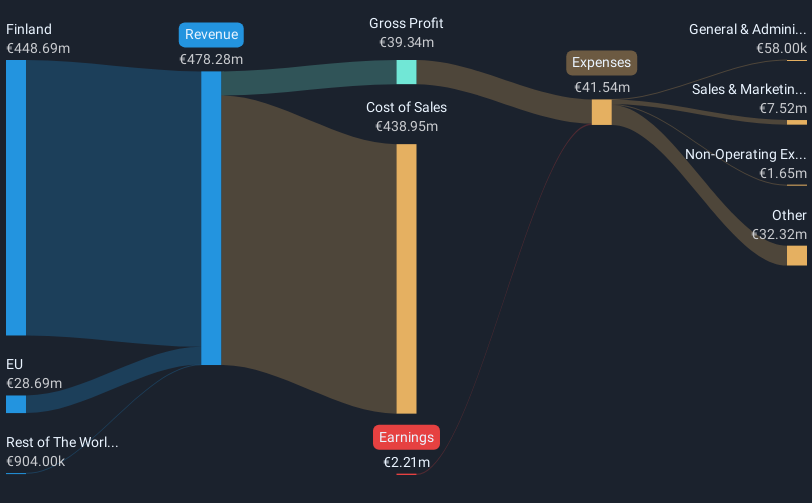
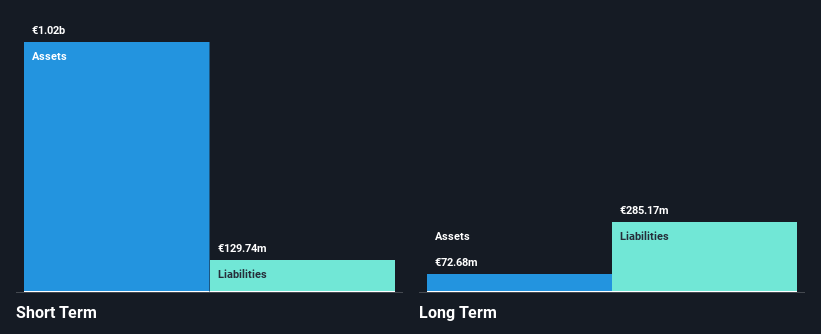
Overview: Verkkokauppa.com Oyj is an online retailer based in Finland with a market cap of €172.56 million.
Operations: The company's revenue is primarily generated from its Online Retailers segment, amounting to €498.33 million.
Market Cap: €172.56M
Verkkokauppa.com Oyj, with a market cap of €172.56 million, is trading below its estimated fair value and has shown profitability in the past year. The company's financial health is robust, with short-term assets exceeding both short- and long-term liabilities, while its debt levels are well covered by cash flow. Despite recent executive departures and an administrative fine due to anti-money laundering compliance issues, earnings have improved significantly compared to last year. The company has initiated a share repurchase program aimed at enhancing capital structure and supporting incentive schemes. Earnings guidance for 2025 indicates expected revenue growth.
- Click to explore a detailed breakdown of our findings in Verkkokauppa.com Oyj's financial health report.
- Learn about Verkkokauppa.com Oyj's future growth trajectory here.
Glenveagh Properties (ISE:GVR)
Simply Wall St Financial Health Rating: ★★★★★☆
Overview: Glenveagh Properties PLC, along with its subsidiaries, constructs and sells houses and apartments for private buyers, local authorities, and the private rental sector in Ireland, with a market cap of approximately €1 billion.
Operations: The company's revenue is primarily derived from its Partnerships segment, generating €192.61 million, with a segment adjustment of €865.99 million.
Market Cap: €1B
Glenveagh Properties PLC, with a market cap of approximately €1 billion, has demonstrated robust financial health as its short-term assets (€1.2 billion) exceed both short- and long-term liabilities. The company's earnings have significantly grown by 169.6% over the past year, surpassing industry averages, and profit margins have improved to 11.8%. Despite an increase in debt levels over five years, the net debt to equity ratio remains satisfactory at 30.3%, with interest payments well covered by EBIT (7.9x). Recent activities include a follow-on equity offering of €50.24 million and an expanded share buyback plan totaling €105 million in authorization value.
- Click here and access our complete financial health analysis report to understand the dynamics of Glenveagh Properties.
- Gain insights into Glenveagh Properties' future direction by reviewing our growth report.
Turning Ideas Into Actions
- Investigate our full lineup of 286 European Penny Stocks right here.
- Looking For Alternative Opportunities? AI is about to change healthcare. These 30 stocks are working on everything from early diagnostics to drug discovery. The best part - they are all under $10b in market cap - there's still time to get in early.
This article by Simply Wall St is general in nature. We provide commentary based on historical data and analyst forecasts only using an unbiased methodology and our articles are not intended to be financial advice. It does not constitute a recommendation to buy or sell any stock, and does not take account of your objectives, or your financial situation. We aim to bring you long-term focused analysis driven by fundamental data. Note that our analysis may not factor in the latest price-sensitive company announcements or qualitative material. Simply Wall St has no position in any stocks mentioned.
Have feedback on this article? Concerned about the content? Get in touch with us directly. Alternatively, email editorial-team@simplywallst.com