
 Nasdaq
 華爾街日報
華爾街日報SEPC Limited (NSE:SEPC) surges 14%; retail investors who own 37% shares profited along with insiders
Key Insights
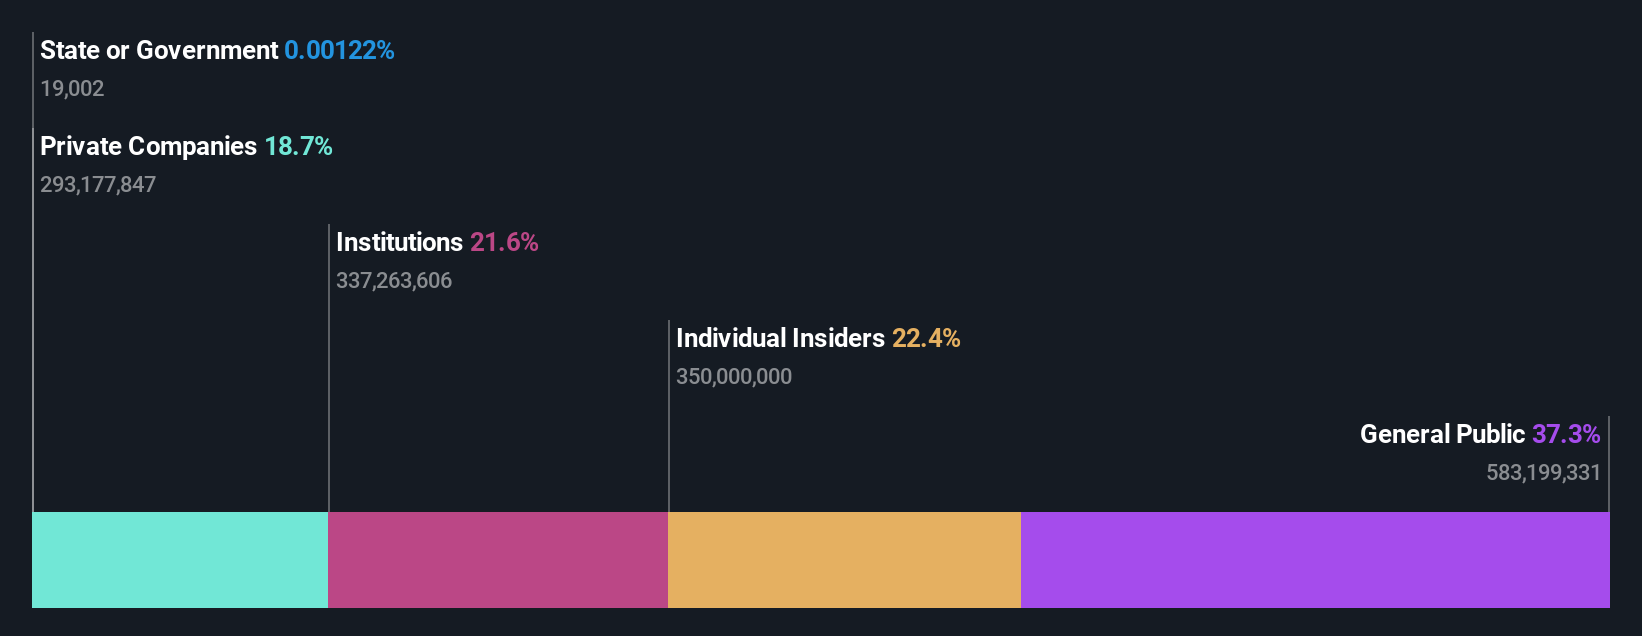
- The considerable ownership by retail investors in SEPC indicates that they collectively have a greater say in management and business strategy
- The top 5 shareholders own 53% of the company
- Insiders own 22% of SEPC
Every investor in SEPC Limited (NSE:SEPC) should be aware of the most powerful shareholder groups. We can see that retail investors own the lion's share in the company with 37% ownership. That is, the group stands to benefit the most if the stock rises (or lose the most if there is a downturn).
Following a 14% increase in the stock price last week, retail investors profited the most, but insiders who own 22% stock also stood to gain from the increase.
Let's delve deeper into each type of owner of SEPC, beginning with the chart below.
See our latest analysis for SEPC
What Does The Institutional Ownership Tell Us About SEPC?
Institutional investors commonly compare their own returns to the returns of a commonly followed index. So they generally do consider buying larger companies that are included in the relevant benchmark index.
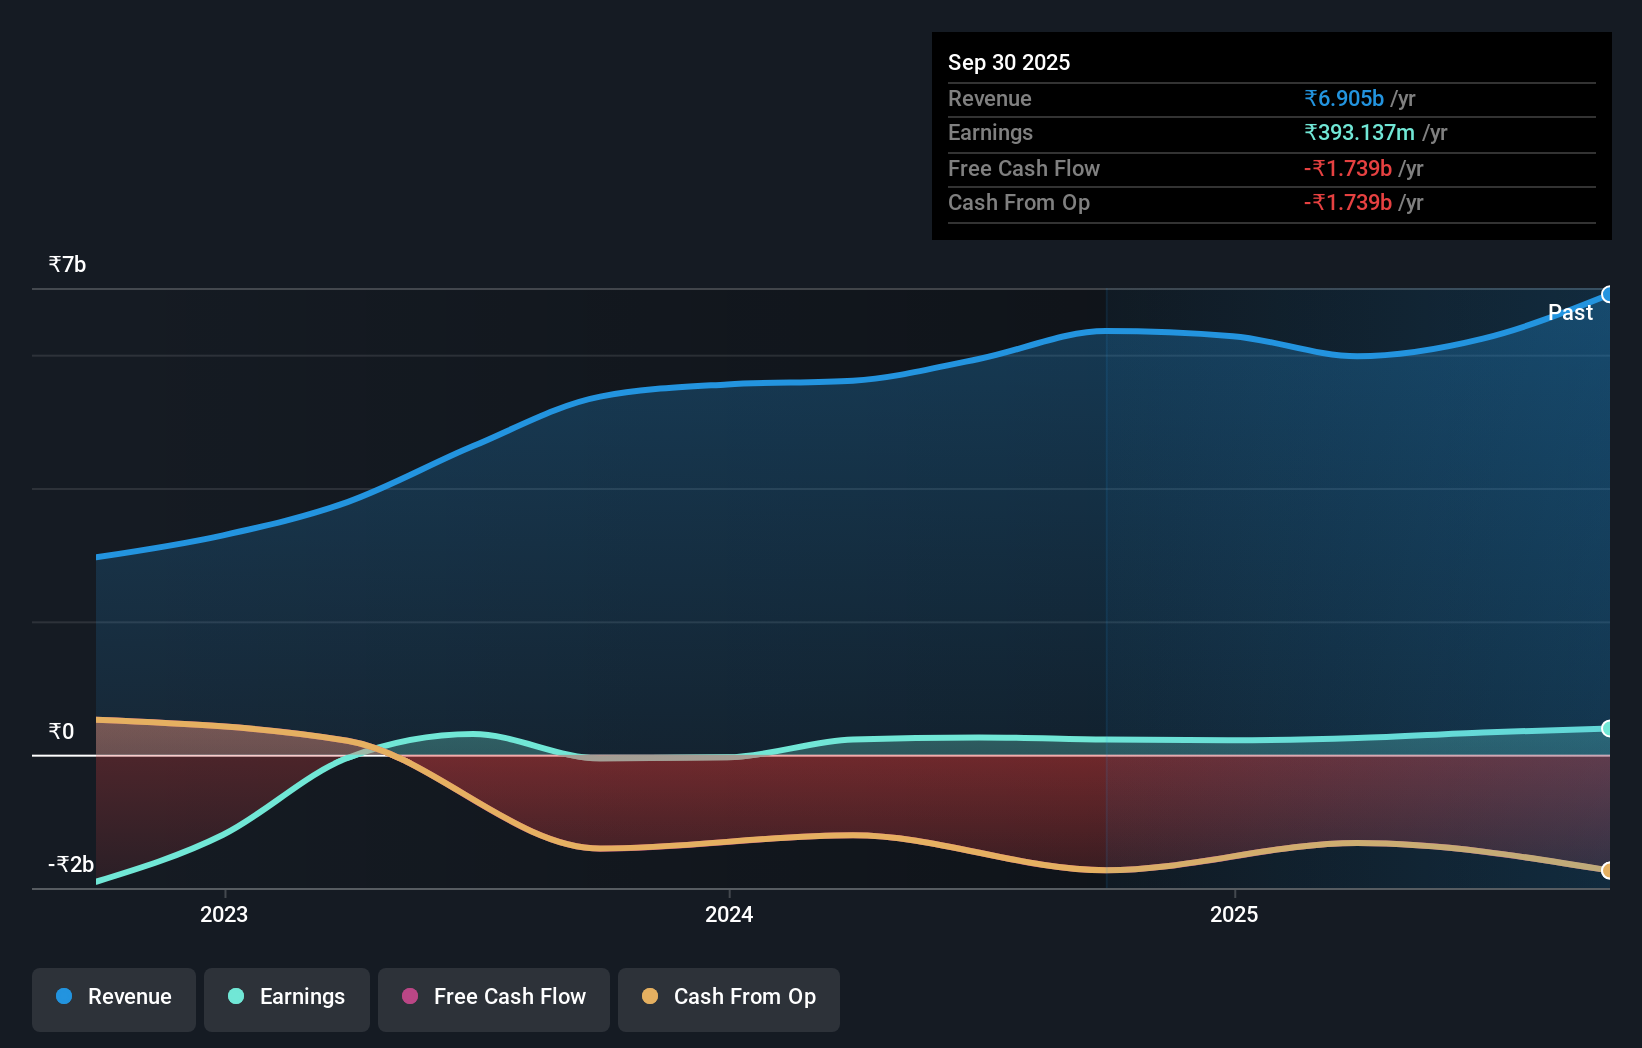
SEPC already has institutions on the share registry. Indeed, they own a respectable stake in the company. This can indicate that the company has a certain degree of credibility in the investment community. However, it is best to be wary of relying on the supposed validation that comes with institutional investors. They too, get it wrong sometimes. If multiple institutions change their view on a stock at the same time, you could see the share price drop fast. It's therefore worth looking at SEPC's earnings history below. Of course, the future is what really matters.
We note that hedge funds don't have a meaningful investment in SEPC. Our data shows that Abdulla Mohammad Ibrahim Abdulla is the largest shareholder with 22% of shares outstanding. Mark Ab Capital Investment Llc is the second largest shareholder owning 12% of common stock, and Shriram Group Pvt. Co. holds about 7.2% of the company stock.
On looking further, we found that 53% of the shares are owned by the top 5 shareholders. In other words, these shareholders have a meaningful say in the decisions of the company.
While it makes sense to study institutional ownership data for a company, it also makes sense to study analyst sentiments to know which way the wind is blowing. As far as we can tell there isn't analyst coverage of the company, so it is probably flying under the radar.
Insider Ownership Of SEPC
While the precise definition of an insider can be subjective, almost everyone considers board members to be insiders. The company management answer to the board and the latter should represent the interests of shareholders. Notably, sometimes top-level managers are on the board themselves.
Insider ownership is positive when it signals leadership are thinking like the true owners of the company. However, high insider ownership can also give immense power to a small group within the company. This can be negative in some circumstances.
Our information suggests that insiders maintain a significant holding in SEPC Limited. It has a market capitalization of just ₹16b, and insiders have ₹3.6b worth of shares in their own names. We would say this shows alignment with shareholders, but it is worth noting that the company is still quite small; some insiders may have founded the business. You can click here to see if those insiders have been buying or selling.
General Public Ownership
With a 37% ownership, the general public, mostly comprising of individual investors, have some degree of sway over SEPC. This size of ownership, while considerable, may not be enough to change company policy if the decision is not in sync with other large shareholders.
Private Company Ownership
We can see that Private Companies own 19%, of the shares on issue. It's hard to draw any conclusions from this fact alone, so its worth looking into who owns those private companies. Sometimes insiders or other related parties have an interest in shares in a public company through a separate private company.
Next Steps:
It's always worth thinking about the different groups who own shares in a company. But to understand SEPC better, we need to consider many other factors. Case in point: We've spotted 1 warning sign for SEPC you should be aware of.
Of course this may not be the best stock to buy. Therefore, you may wish to see our free collection of interesting prospects boasting favorable financials.
NB: Figures in this article are calculated using data from the last twelve months, which refer to the 12-month period ending on the last date of the month the financial statement is dated. This may not be consistent with full year annual report figures.
Have feedback on this article? Concerned about the content? Get in touch with us directly. Alternatively, email editorial-team (at) simplywallst.com.
This article by Simply Wall St is general in nature. We provide commentary based on historical data and analyst forecasts only using an unbiased methodology and our articles are not intended to be financial advice. It does not constitute a recommendation to buy or sell any stock, and does not take account of your objectives, or your financial situation. We aim to bring you long-term focused analysis driven by fundamental data. Note that our analysis may not factor in the latest price-sensitive company announcements or qualitative material. Simply Wall St has no position in any stocks mentioned.