
 Nasdaq
 華爾街日報
華爾街日報Is There Still Upside in Arm After the Recent AI Driven Rally Cools?
- If you are wondering whether Arm Holdings is attractively priced today or whether the excitement is already fully reflected in the share price, you are in the right place to unpack what the market might be missing.
- After a sharp rally earlier in the year, the stock has recently cooled off, with the price down around 11% over the last week and month, and about 3% lower year to date, leaving it roughly 14.2% below where it was a year ago.
- These swings come as investors digest Arm’s push deeper into AI related designs and partnerships, along with growing interest from major cloud and chip players looking to license its architectures. Taken together, these developments are reshaping expectations for how much long term growth Arm can realistically deliver and how cyclical its revenue stream might be.
- Right now, Arm scores just 1 out of 6 on our undervaluation checks, which suggests the stock is not obviously cheap on most traditional metrics. Next, we will walk through the main valuation approaches investors are using, and then finish with a more holistic way to think about what Arm is really worth.
Arm Holdings scores just 1/6 on our valuation checks. See what other red flags we found in the full valuation breakdown.
Approach 1: Arm Holdings Discounted Cash Flow (DCF) Analysis
A Discounted Cash Flow model estimates what a company is worth by projecting the cash it can generate in the future, then discounting those cash flows back to today in $ terms.
For Arm Holdings, the latest twelve month Free Cash Flow is about $1.29 billion. Analysts and internal estimates project this to rise to roughly $5.27 billion by 2030, with a detailed 2 Stage Free Cash Flow to Equity model mapping out growth through 2035. Early years rely on analyst forecasts, while the later years are extrapolated by Simply Wall St based on expected growth trends.
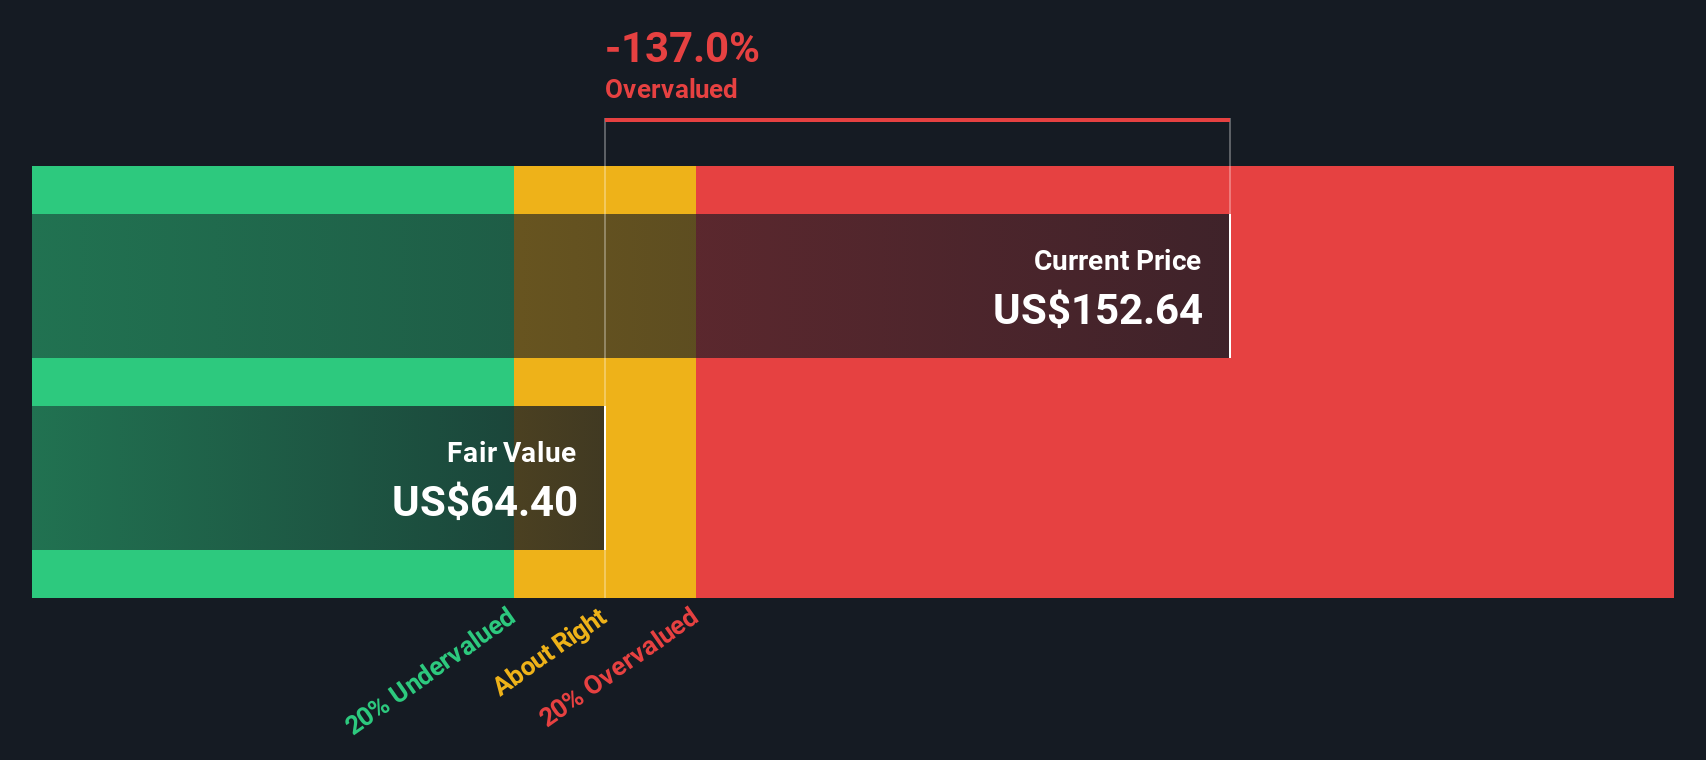
When these projected cash flows are discounted back, the model arrives at an intrinsic value of about $64.31 per share. Compared with the current share price, this implies the stock is around 93.4% overvalued. This suggests that today’s market price is baking in far more optimism than the cash flow outlook supports.
Result: OVERVALUED
Our Discounted Cash Flow (DCF) analysis suggests Arm Holdings may be overvalued by 93.4%. Discover 908 undervalued stocks or create your own screener to find better value opportunities.
Approach 2: Arm Holdings Price vs Sales
For profitable, growing companies like Arm, revenue-based valuation using the Price to Sales ratio can be helpful because it focuses on how much investors are paying for each dollar of sales, which tends to be more stable than short-term earnings swings.
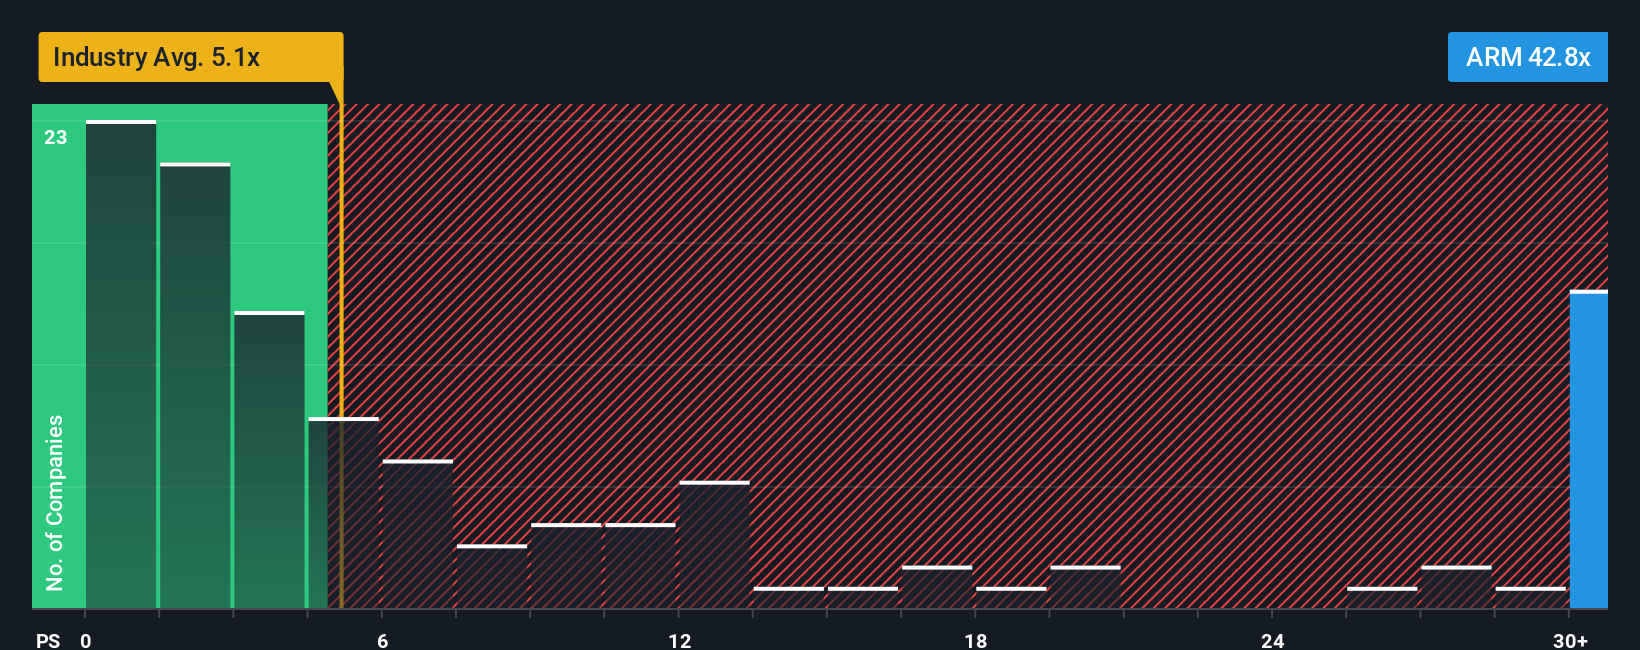
In general, higher growth and lower risk justify a higher multiple, while slower or more uncertain growth should trade closer to, or below, the market and industry averages. Arm currently trades on a Price to Sales ratio of about 29.9x, compared with roughly 5.4x for the broader Semiconductor industry and around 7.4x for its peer group. This highlights how much optimism is already reflected in the valuation.
Simply Wall St’s Fair Ratio framework estimates what a reasonable Price to Sales multiple could be for Arm, given its growth outlook, profitability, industry, size and risk profile. This proprietary Fair Ratio for Arm is 37.4x, which is higher than both the industry and peer averages, reflecting the company’s strong growth potential and margins. Because the Fair Ratio sits above the current 29.9x, this approach indicates that the stock may be somewhat undervalued relative to its fundamentals, even though it appears expensive versus peers on simple comparisons.
Result: UNDERVALUED
PS ratios tell one story, but what if the real opportunity lies elsewhere? Discover 1446 companies where insiders are betting big on explosive growth.
Upgrade Your Decision Making: Choose your Arm Holdings Narrative
Earlier we mentioned that there is an even better way to understand valuation, so let us introduce you to Narratives, a simple way to connect your view of Arm’s story with numbers like future revenue, earnings, margins, and ultimately a fair value estimate.
A Narrative is your investment storyline for a company, where you spell out what you think will happen in the business and then tie that view directly into a financial forecast and a fair value per share, instead of treating the numbers as abstract or purely model driven.
On Simply Wall St, Narratives live in the Community page and are designed to be easy and accessible, helping investors decide how to act by comparing their Narrative Fair Value to the current market price and seeing whether the gap offers enough potential upside or signals downside risk.
Because Narratives are dynamically updated when new earnings, news, or guidance is released, your fair value and thesis evolve in real time. Two investors looking at Arm today might reasonably anchor on very different fair values, for example around 70 dollars versus 210 dollars per share, based on how optimistic or cautious they are about AI driven growth and margins.
For Arm Holdings however, we will make it really easy for you with previews of two leading Arm Holdings Narratives:
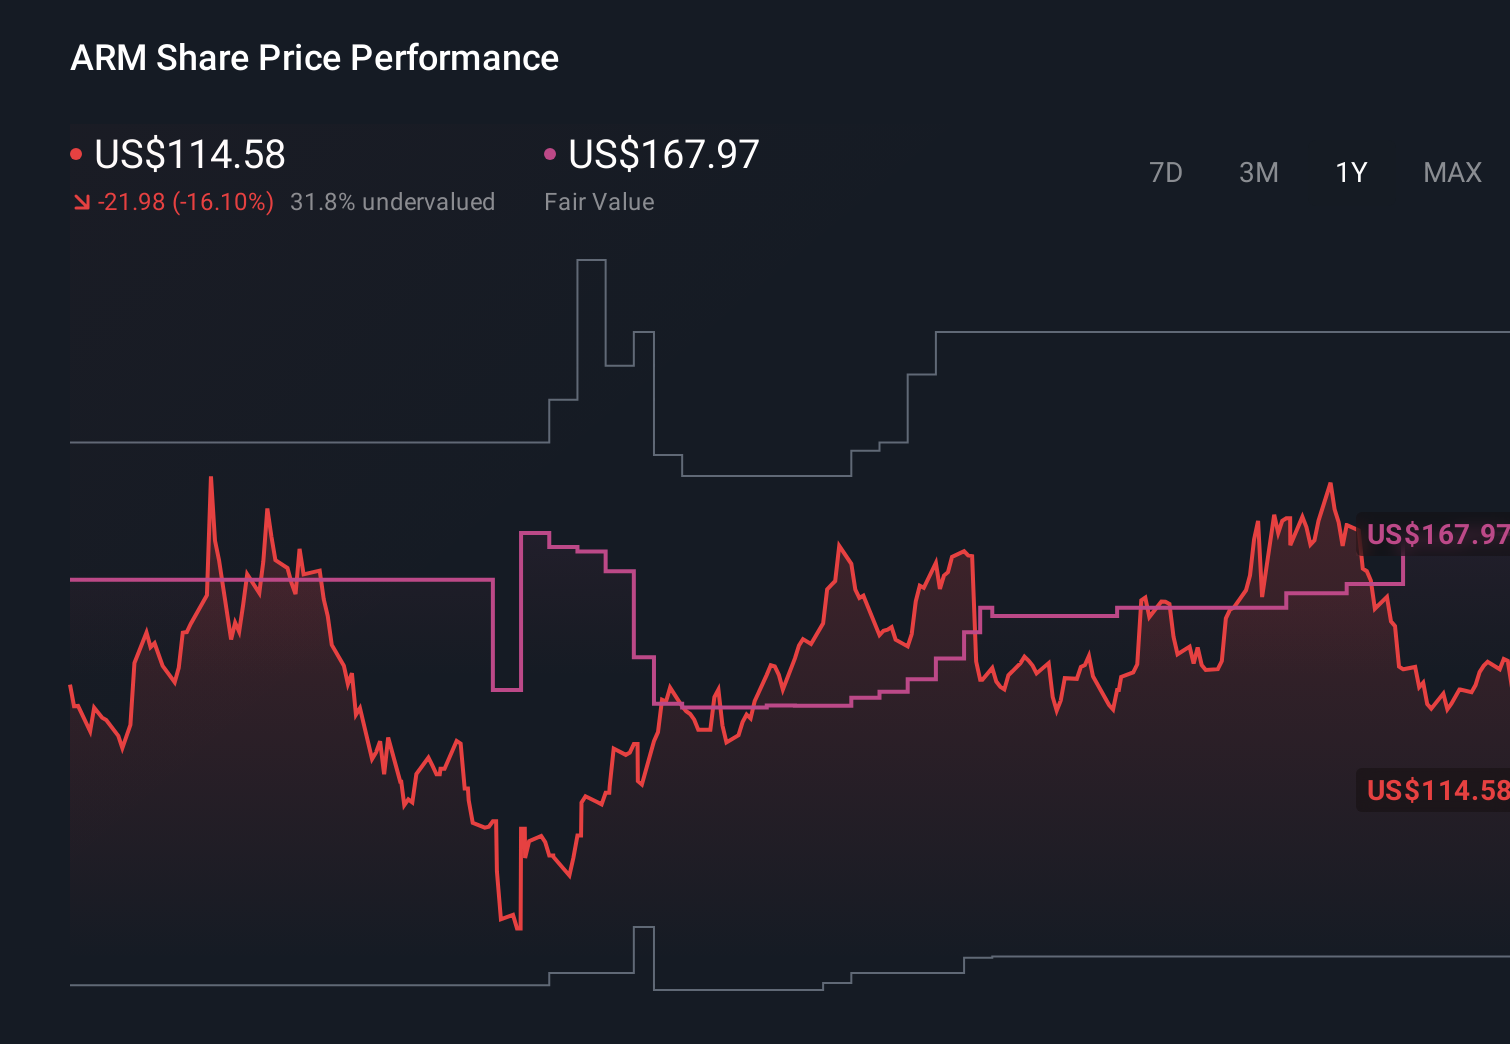
Narrative Fair Value: $167.97 per share
Implied Upside vs Current Price: 26.0% undervalued
Forecast Revenue Growth: 22.14% per year
- Sees Arm's expanding AI, IoT, and edge footprint, plus a 22 million plus developer ecosystem, as key drivers of recurring licensing and royalty growth and steadily rising margins.
- Highlights premiumization of Arm's IP, with newer platforms like v9 and CSS commanding higher royalty rates that support long term earnings and free cash flow expansion.
- Flags risks around execution in new compute segments, smartphone dependence, rising R&D spend, China exposure, and hyperscalers' in house silicon, but concludes that the current price offers moderate upside to a fair value of about $168.
Narrative Fair Value: $70.00 per share
Implied Downside vs Current Price: 77.7% overvalued
Forward Earnings Based Revenue View: revenue growth assumed to slow, with a 4.25% contraction embedded in the cautious framework
- Values Arm off a forward earnings yield anchored to the 10 year U.S. Treasury, arriving at a fair value of $70 per share and a risk adjusted target of $56 after applying a 20% discount for macro and rate uncertainty.
- Argues that trading in the $120 to $140 range places Arm firmly in a bubble wave where sentiment, AI hype, and liquidity dominate fundamentals and push the implied earnings yield below the 10 year Treasury.
- Notes that while a euphoric phase could send the stock as high as $170 to $213, such levels would leave almost no margin of safety and expose investors to sharp downside if rates, earnings, or risk appetite shift.
Do you think there's more to the story for Arm Holdings? Head over to our Community to see what others are saying!
This article by Simply Wall St is general in nature. We provide commentary based on historical data and analyst forecasts only using an unbiased methodology and our articles are not intended to be financial advice. It does not constitute a recommendation to buy or sell any stock, and does not take account of your objectives, or your financial situation. We aim to bring you long-term focused analysis driven by fundamental data. Note that our analysis may not factor in the latest price-sensitive company announcements or qualitative material. Simply Wall St has no position in any stocks mentioned.
Have feedback on this article? Concerned about the content? Get in touch with us directly. Alternatively, email editorial-team@simplywallst.com