
 Nasdaq
 華爾街日報
華爾街日報Is YETI Holdings At An Attractive Price After Recent Share Price Recovery In 2025
- Wondering if YETI Holdings is finally at a buyable price, or if the market is still clinging to the brand hype? Let us unpack what the numbers are actually saying about value here.
- After a choppy few years, the stock has crept higher, up 1.0% over the past week and 16.2% over the last month. That brings its year-to-date gain to 15.6% but leaves the 1-year return almost flat at 0.3%, and the 5-year return still down about 40.0% from earlier highs.
- Recently, YETI has stayed in the conversation thanks to ongoing product innovation, distribution expansion, and the durability of its lifestyle brand in a competitive outdoor market. Investors are weighing how much of that brand power and growth runway is already reflected in the current share price, especially after a long comedown from peak enthusiasm.
- On our checklist of six valuation tests, YETI scores a 4 out of 6, suggesting the market may still be underestimating parts of the story. We will walk through what different valuation approaches say about that and outline a more structured way to think about fair value by the end of this article.
Find out why YETI Holdings's 0.3% return over the last year is lagging behind its peers.
Approach 1: YETI Holdings Discounted Cash Flow (DCF) Analysis
A Discounted Cash Flow model estimates what a business is worth today by projecting the cash it can generate in the future and discounting those cash flows back to the present.
For YETI Holdings, the latest twelve month Free Cash Flow stands at about $214 million. Analysts and model estimates see this rising steadily, with projected Free Cash Flow reaching roughly $411 million by 2035, based on a 2 Stage Free Cash Flow to Equity approach that blends explicit forecasts with longer term growth assumptions generated by Simply Wall St.
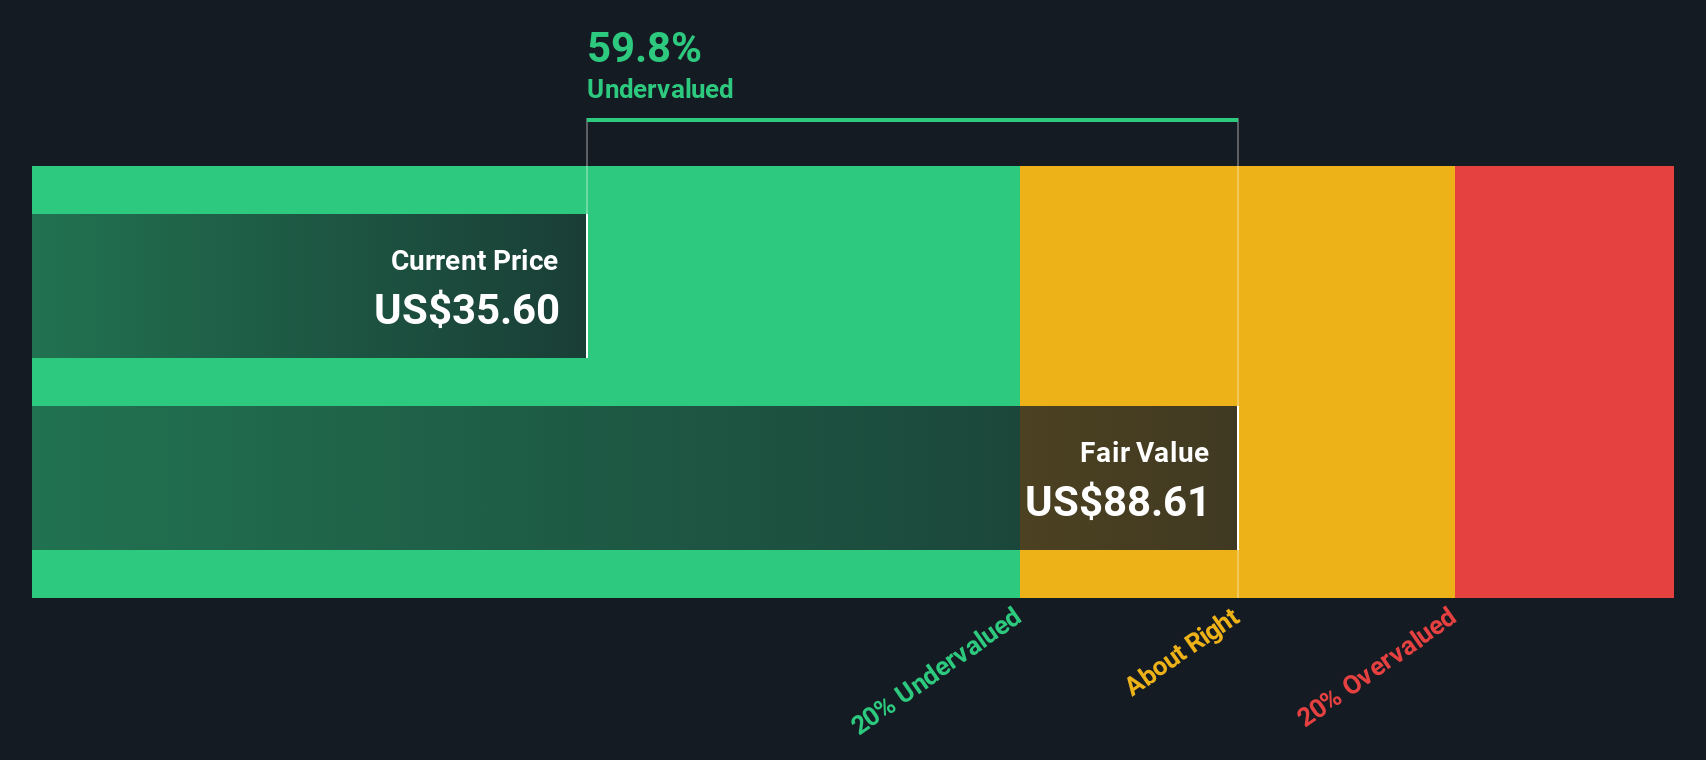
Bringing all those future cash flows back to today produces an estimated intrinsic value of about $94.43 per share. Compared to the current share price, this implies roughly a 54.1% discount. This indicates the market is still pricing YETI as if its cash generation will be meaningfully weaker than the model assumes.
Result: UNDERVALUED
Our Discounted Cash Flow (DCF) analysis suggests YETI Holdings is undervalued by 54.1%. Track this in your watchlist or portfolio, or discover 908 more undervalued stocks based on cash flows.
Approach 2: YETI Holdings Price vs Earnings
The Price to Earnings ratio is a useful way to value a profitable company like YETI because it ties the share price directly to the earnings that shareholders ultimately rely on. In general, faster-growing and lower-risk businesses can justify paying a higher PE multiple, while slower, more cyclical, or riskier companies tend to trade on lower multiples over time.
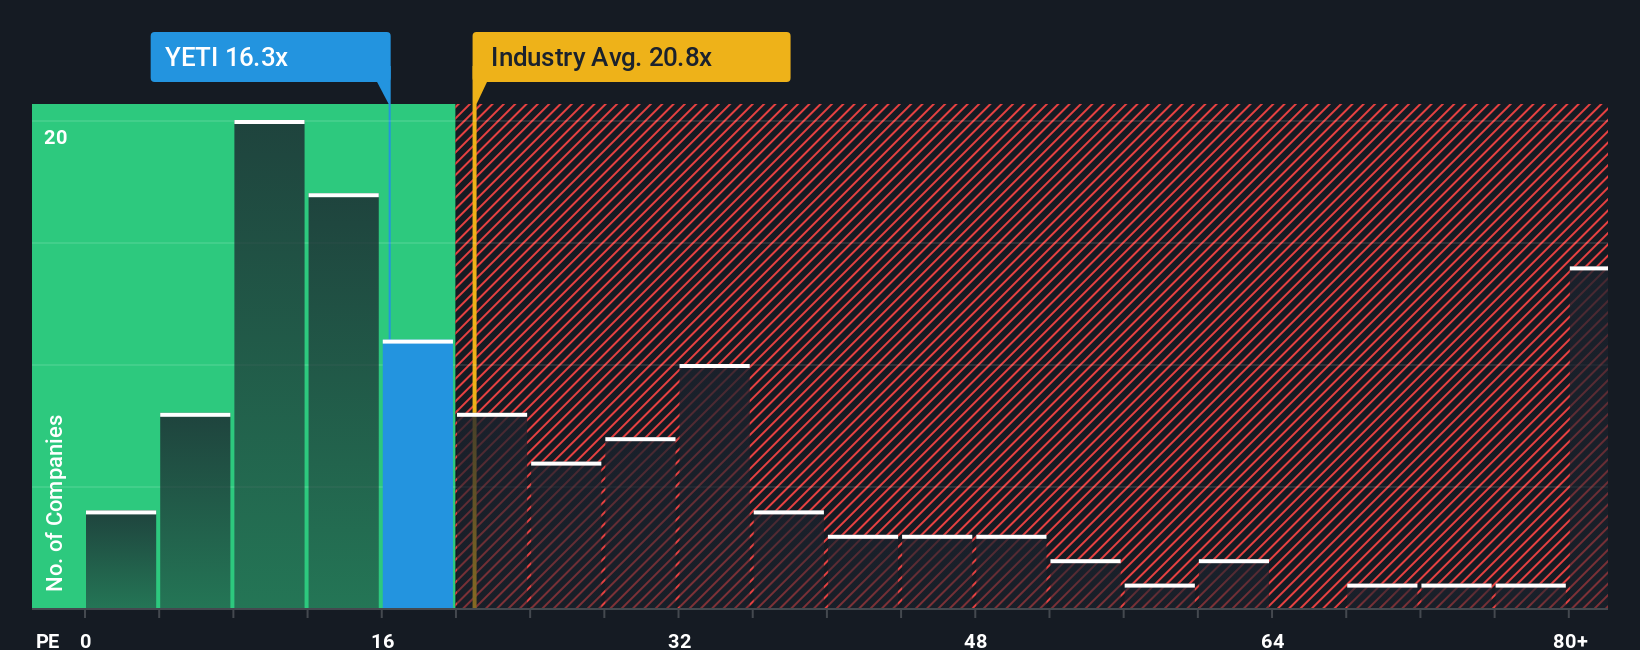
YETI currently trades on a PE of about 21.0x. That sits slightly below the Leisure industry average of around 21.6x, and meaningfully below a broader peer group that averages roughly 29.6x, suggesting the market is not awarding YETI a premium multiple despite its brand strength and growth profile. Simply Wall St’s proprietary Fair Ratio for YETI is 15.8x, which estimates what a normal PE should be given its earnings growth outlook, margins, industry, market cap, and risk characteristics.
This Fair Ratio is more tailored than a simple peer or industry comparison because it adjusts for YETI’s specific fundamentals rather than assuming all Leisure names deserve the same multiple. With the shares trading at 21.0x versus a Fair Ratio of 15.8x, the stock screens as meaningfully more expensive than its fundamentals would justify.
Result: OVERVALUED
PE ratios tell one story, but what if the real opportunity lies elsewhere? Discover 1446 companies where insiders are betting big on explosive growth.
Upgrade Your Decision Making: Choose your YETI Holdings Narrative
Earlier we mentioned that there is an even better way to understand valuation. Let us introduce you to Narratives, a simple framework on Simply Wall St’s Community page that lets you attach a story to your numbers. It links your view of a company’s future revenue, earnings, and margins to a concrete forecast, a calculated Fair Value, and a clear buy or sell signal as that Fair Value is compared with today’s Price. This is then automatically updated when new information, like earnings or major news, comes in. One investor might build a bullish YETI Holdings Narrative around rapid international expansion, successful product innovation, and premium pricing that supports a Fair Value near the top end of recent analyst targets around $53 per share. Another more cautious investor could construct a conservative Narrative that assumes slower drinkware growth, tougher competition, and higher execution risk, leading them to a Fair Value closer to the lower end, around $32 per share. Both views can live side by side on the platform so you can see which story, and which price, you actually believe.
Do you think there's more to the story for YETI Holdings? Head over to our Community to see what others are saying!

This article by Simply Wall St is general in nature. We provide commentary based on historical data and analyst forecasts only using an unbiased methodology and our articles are not intended to be financial advice. It does not constitute a recommendation to buy or sell any stock, and does not take account of your objectives, or your financial situation. We aim to bring you long-term focused analysis driven by fundamental data. Note that our analysis may not factor in the latest price-sensitive company announcements or qualitative material. Simply Wall St has no position in any stocks mentioned.
Have feedback on this article? Concerned about the content? Get in touch with us directly. Alternatively, email editorial-team@simplywallst.com