
 Nasdaq
 華爾街日報
華爾街日報Assessing UiPath Stock After Recent Volatility and AI Automation Growth Narrative
- Wondering if UiPath at around $16 a share is quietly setting up a bargain, or just another hype name in automation? Let's cut through the noise and focus on what the numbers are really saying about its value.
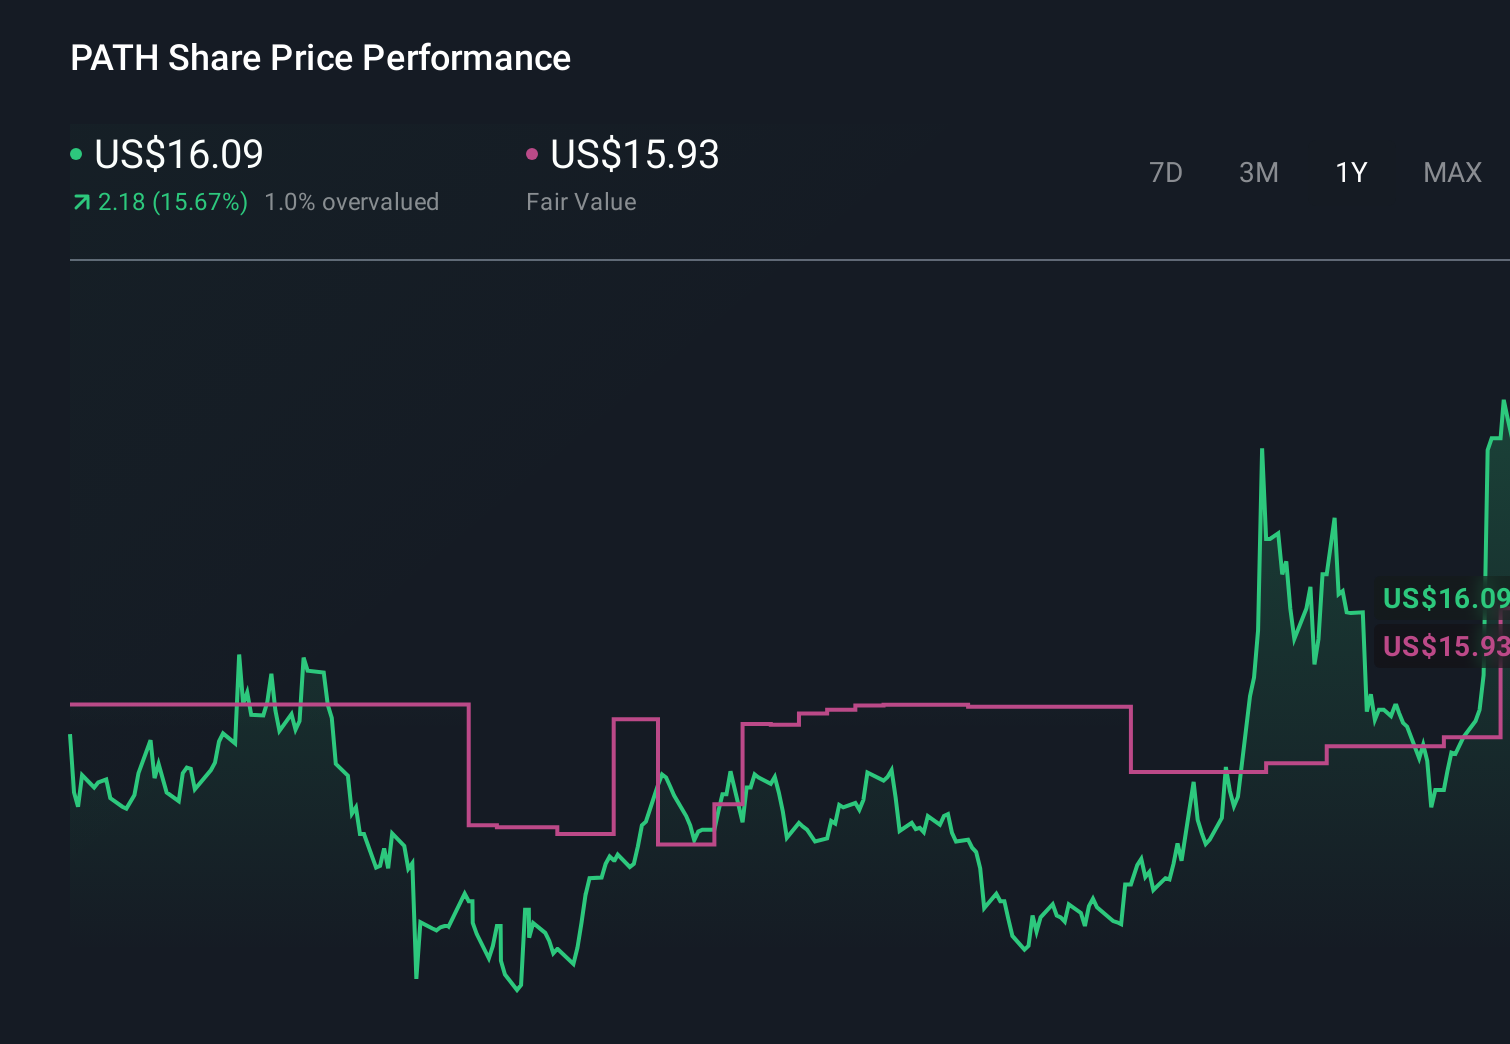
- The stock has been choppy lately, sliding about 16.2% over the last week, but still up roughly 15.2% over the past month and 25.0% year to date, which tells you sentiment is shifting fast. Over the last year it is still sitting on a 14.9% gain, and roughly 29.5% higher over three years, hinting at long term optimism despite short term volatility.
- Recently, the narrative around UiPath has leaned heavily on how its AI driven automation tools are being adopted by large enterprises, with new partnerships and platform enhancements keeping it in the conversation as a key beneficiary of the AI and productivity boom. At the same time, broader tech sector swings and changing views on growth versus profitability have added extra volatility to the share price, which makes understanding its underlying value even more important.
- Right now, UiPath scores a 2/6 on our valuation checks, meaning it screens as undervalued on only two of six metrics, so it is not an obvious deep value play on headline numbers alone. In the sections that follow, we will walk through the main valuation approaches for UiPath and, by the end, explore a more powerful way to think about what the stock is really worth over the long run.
UiPath scores just 2/6 on our valuation checks. See what other red flags we found in the full valuation breakdown.
Approach 1: UiPath Discounted Cash Flow (DCF) Analysis
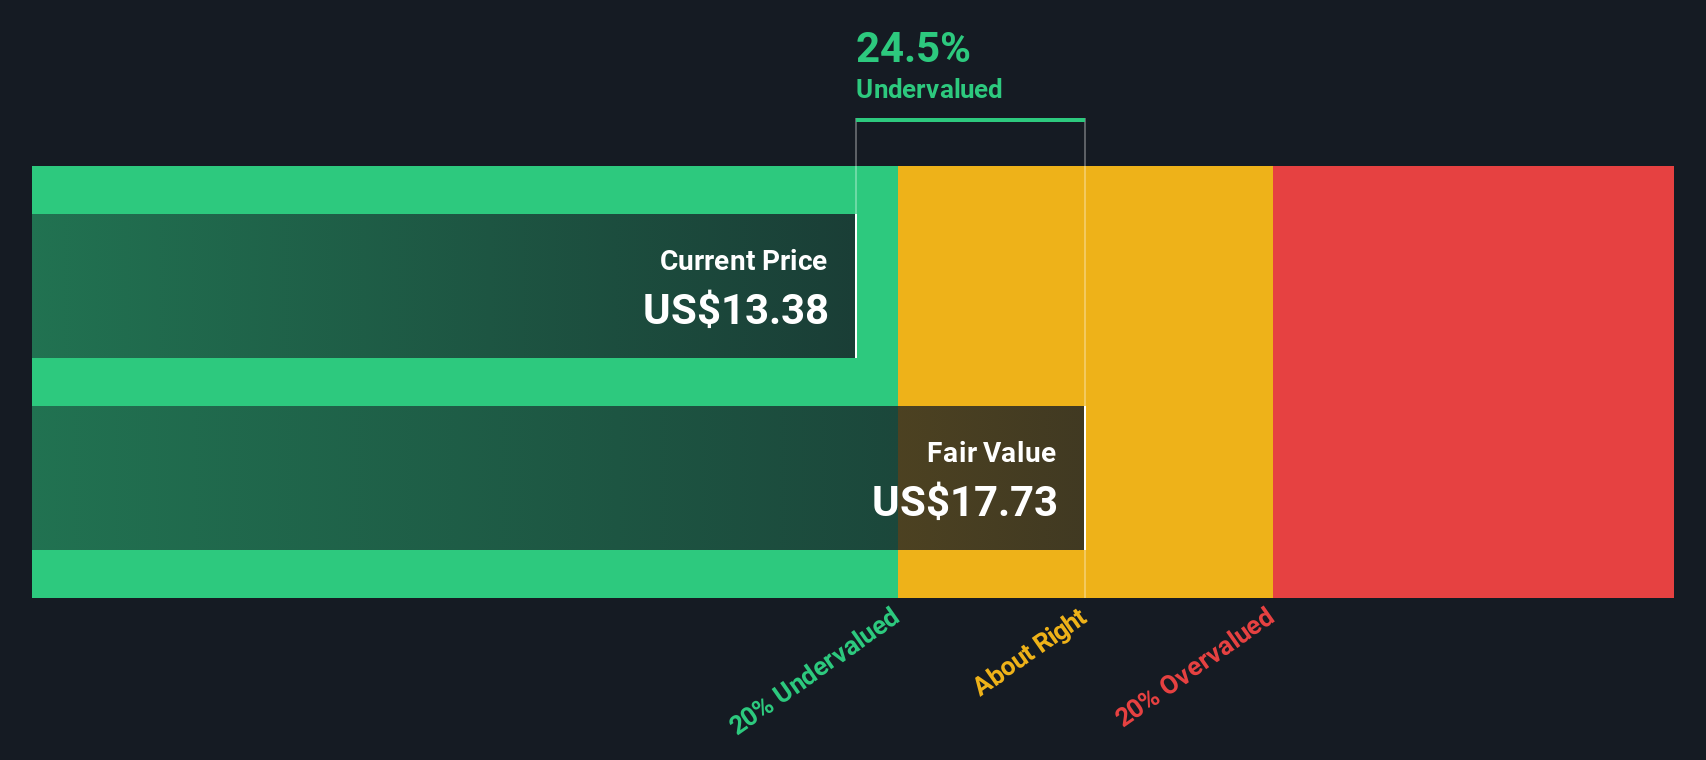
A Discounted Cash Flow model estimates what a business is worth by projecting the cash it can generate in the future and then discounting those cash flows back to today in $ terms. For UiPath, the latest twelve month free cash flow sits at about $319.9 Million, and analysts see this rising to roughly $471.2 Million by 2028 as its automation platform scales.
Beyond the analyst window, Simply Wall St extends those forecasts out to 2035 using a 2 stage Free Cash Flow to Equity approach, gradually tapering growth as the business matures. When all of those projected cash flows are discounted back, the model arrives at an intrinsic value of around $17.75 per share, in $ and based on current projections.
Against a market price near $16, that implies UiPath is about 8.9% undervalued, which is a mild, not dramatic, discount. In other words, the DCF suggests the stock is trading roughly in line with its long term cash generation prospects.
Result: ABOUT RIGHT
UiPath is fairly valued according to our Discounted Cash Flow (DCF), but this can change at a moment's notice. Track the value in your watchlist or portfolio and be alerted on when to act.
Approach 2: UiPath Price vs Earnings
For a business like UiPath that is now generating profits, the price to earnings ratio is a useful way to gauge how much investors are willing to pay for each dollar of current earnings. Higher growth and lower perceived risk usually justify a higher PE, while slower or more uncertain growth typically points to a lower, more conservative multiple.
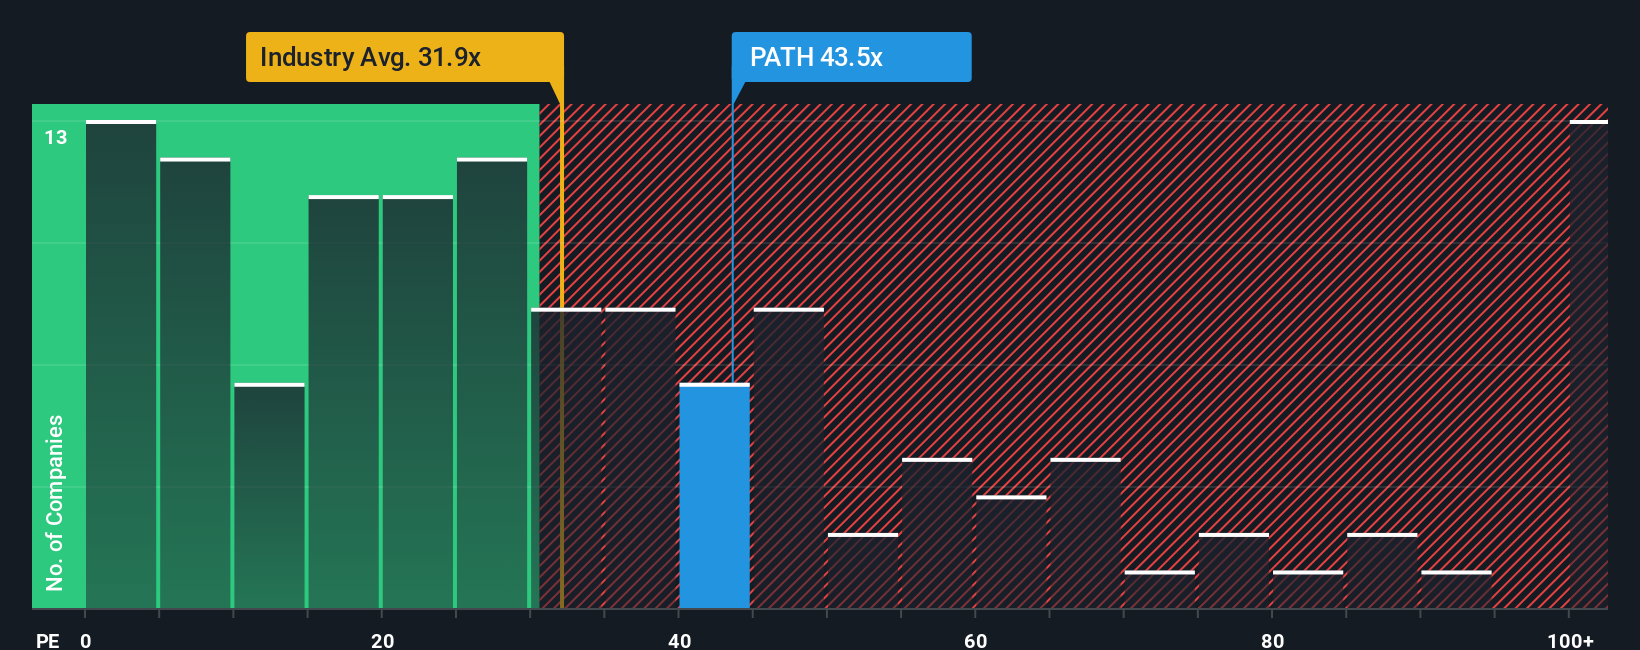
UiPath currently trades on about 37.6x earnings. That is slightly above the broader Software industry average of roughly 32.9x, but well below the 60.7x average of its faster growing peers. To refine this comparison, Simply Wall St uses a proprietary Fair Ratio, which estimates what a reasonable PE should be given UiPath’s specific earnings growth outlook, profitability, risk profile, industry and market cap. For UiPath, that Fair Ratio comes out at around 14.6x.
Because the Fair Ratio bakes in company level growth and risk rather than relying only on broad peer or industry averages, it gives a more tailored view of value. With UiPath’s actual PE of 37.6x sitting well above the 14.6x Fair Ratio, the stock screens as expensive on an earnings based lens.
Result: OVERVALUED
PE ratios tell one story, but what if the real opportunity lies elsewhere? Discover 1446 companies where insiders are betting big on explosive growth.
Upgrade Your Decision Making: Choose your UiPath Narrative
Earlier we mentioned that there is an even better way to understand valuation. Let us introduce you to Narratives, a simple framework on Simply Wall St’s Community page where you connect your story about UiPath to a concrete financial forecast and, ultimately, a fair value estimate that you can compare to today’s price to help you decide whether to buy, hold, or sell.
In practice, a Narrative lets you spell out how you think UiPath’s AI partnerships, product launches and competitive pressures will shape future revenue, earnings and margins. It then automatically turns those assumptions into a dynamic fair value that updates as new information, such as earnings or major news, comes in.
Because each investor can build their own Narrative, you can quickly see how a more optimistic view might justify a higher fair value closer to the bullish 17 dollars target. By contrast, a more cautious stance might anchor nearer the 11.71 dollars bearish target. This can help you understand not just what other investors think UiPath is worth, but why they think that, and where your own view fits on that spectrum.
Do you think there's more to the story for UiPath? Head over to our Community to see what others are saying!
This article by Simply Wall St is general in nature. We provide commentary based on historical data and analyst forecasts only using an unbiased methodology and our articles are not intended to be financial advice. It does not constitute a recommendation to buy or sell any stock, and does not take account of your objectives, or your financial situation. We aim to bring you long-term focused analysis driven by fundamental data. Note that our analysis may not factor in the latest price-sensitive company announcements or qualitative material. Simply Wall St has no position in any stocks mentioned.
Have feedback on this article? Concerned about the content? Get in touch with us directly. Alternatively, email editorial-team@simplywallst.com