
 Nasdaq
 華爾街日報
華爾街日報Is SLB Offering Long Term Value After Its Digital and Low Carbon Expansion?
- If you are wondering whether SLB is quietly becoming a value opportunity while the market is distracted, this article will walk you through whether the current price really lines up with the business behind the ticker.
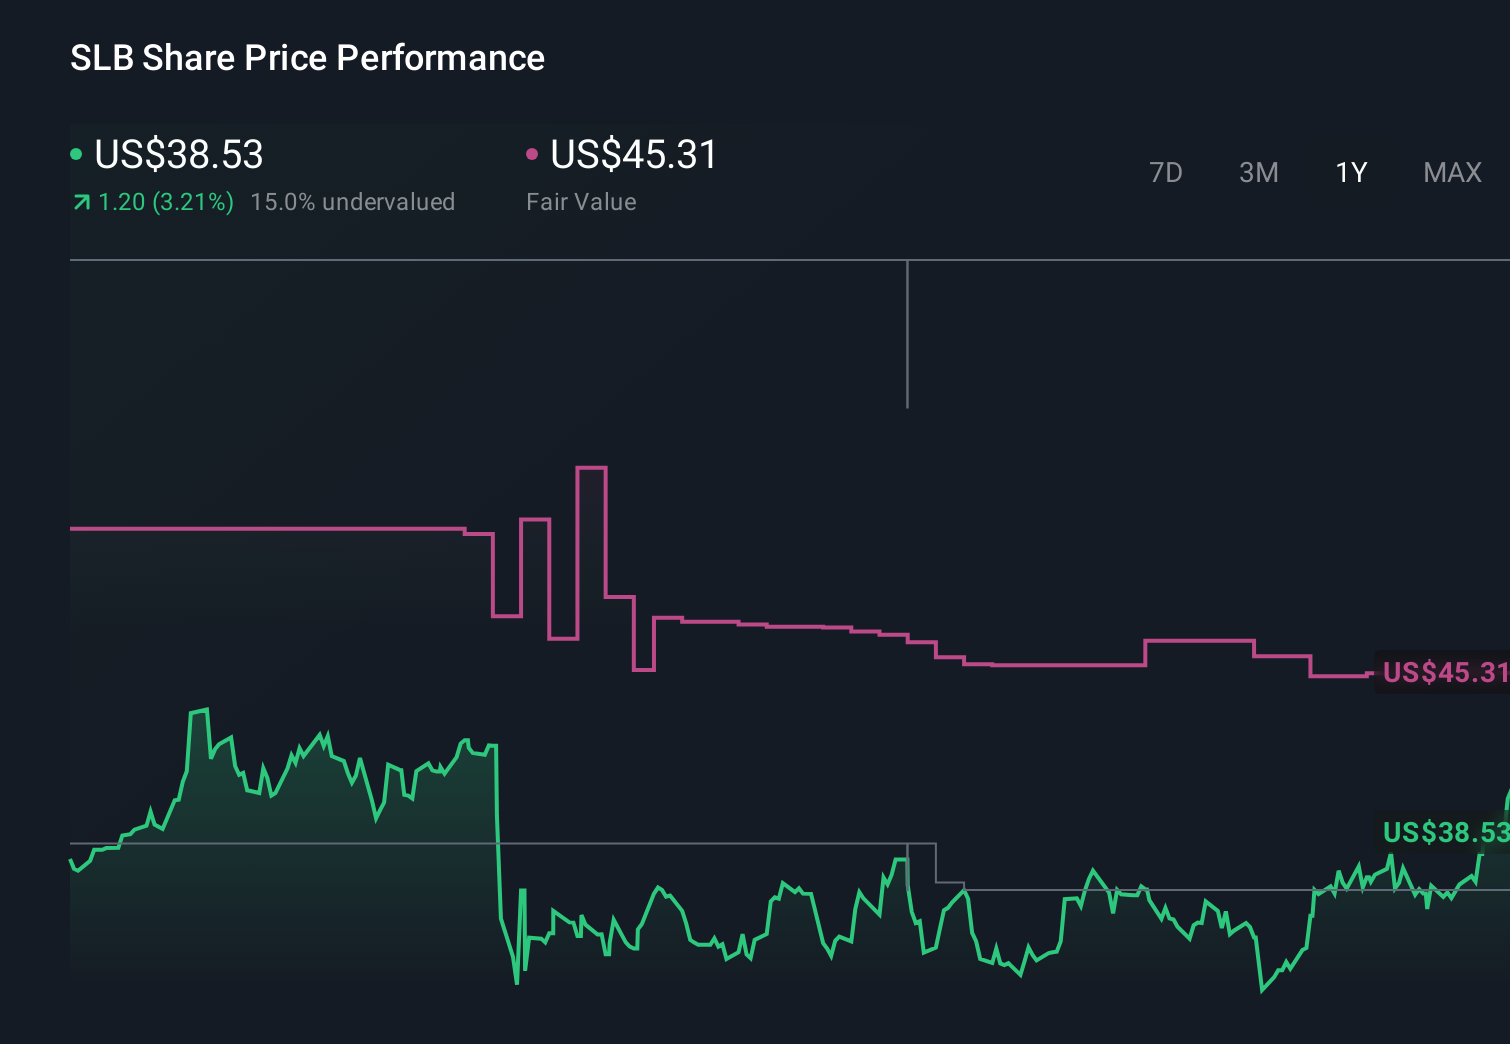
- After a choppy few years, SLB has inched up 1.7% over the last week and 5.3% over the last month, while still only 0.6% higher over the past year despite being up 98.8% over five years.
- Recent headlines have focused on SLB doubling down on digital and low carbon technologies, including expanded partnerships in subsurface data and new contracts that position it to benefit from long term energy transition spending. At the same time, investors are reassessing traditional oilfield service names as capital discipline, supply constraints, and geopolitical tensions reshape expectations for future drilling activity.
- On our framework, SLB scores a 5/6 valuation check. This suggests it screens as undervalued on most metrics. Next, we will unpack what different valuation approaches say about that number and hint at an even better way to interpret value by the end of the article.
Find out why SLB's 0.6% return over the last year is lagging behind its peers.
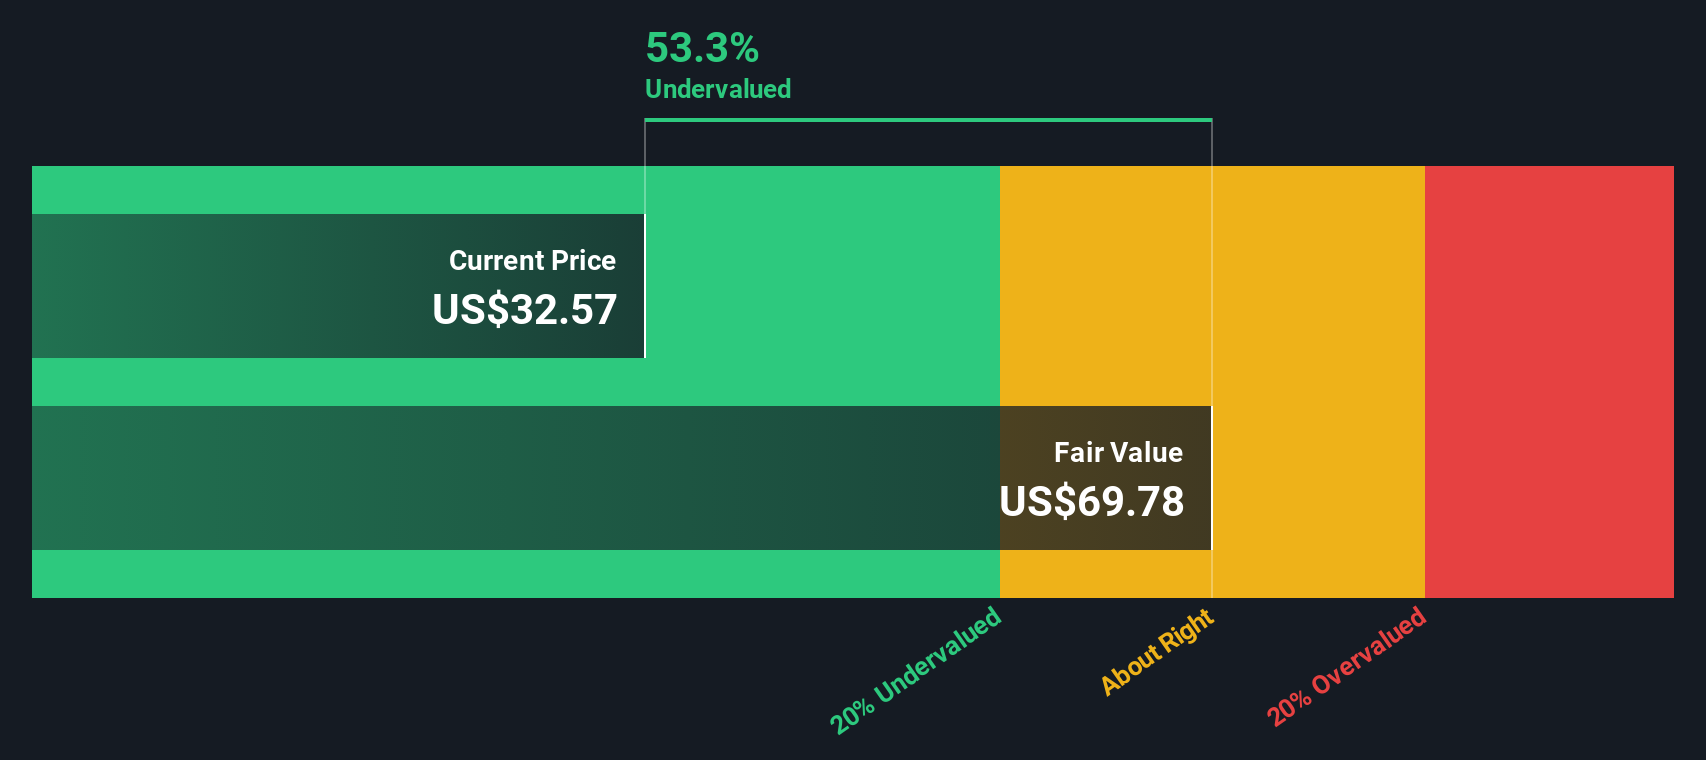
Approach 1: SLB Discounted Cash Flow (DCF) Analysis
A Discounted Cash Flow model estimates what a business is worth today by projecting the cash it can generate in the future and then discounting those cash flows back to the present.
For SLB, the latest twelve month Free Cash Flow stands at about $3.3 billion. Using analyst forecasts where available, and then extrapolating beyond that, Simply Wall St projects Free Cash Flow rising to around $7.6 billion by 2035, with interim years gradually stepping up from roughly $4.8 billion in 2026. These future cash flows, all in $, are then discounted using a 2 Stage Free Cash Flow to Equity model to arrive at an estimated intrinsic value of $90.53 per share.
Compared with the current share price, this implies a 57.0% discount, which indicates that the market is paying far less than what the projected cash generation would justify under the stated assumptions.
Result: UNDERVALUED
Our Discounted Cash Flow (DCF) analysis suggests SLB is undervalued by 57.0%. Track this in your watchlist or portfolio, or discover 908 more undervalued stocks based on cash flows.
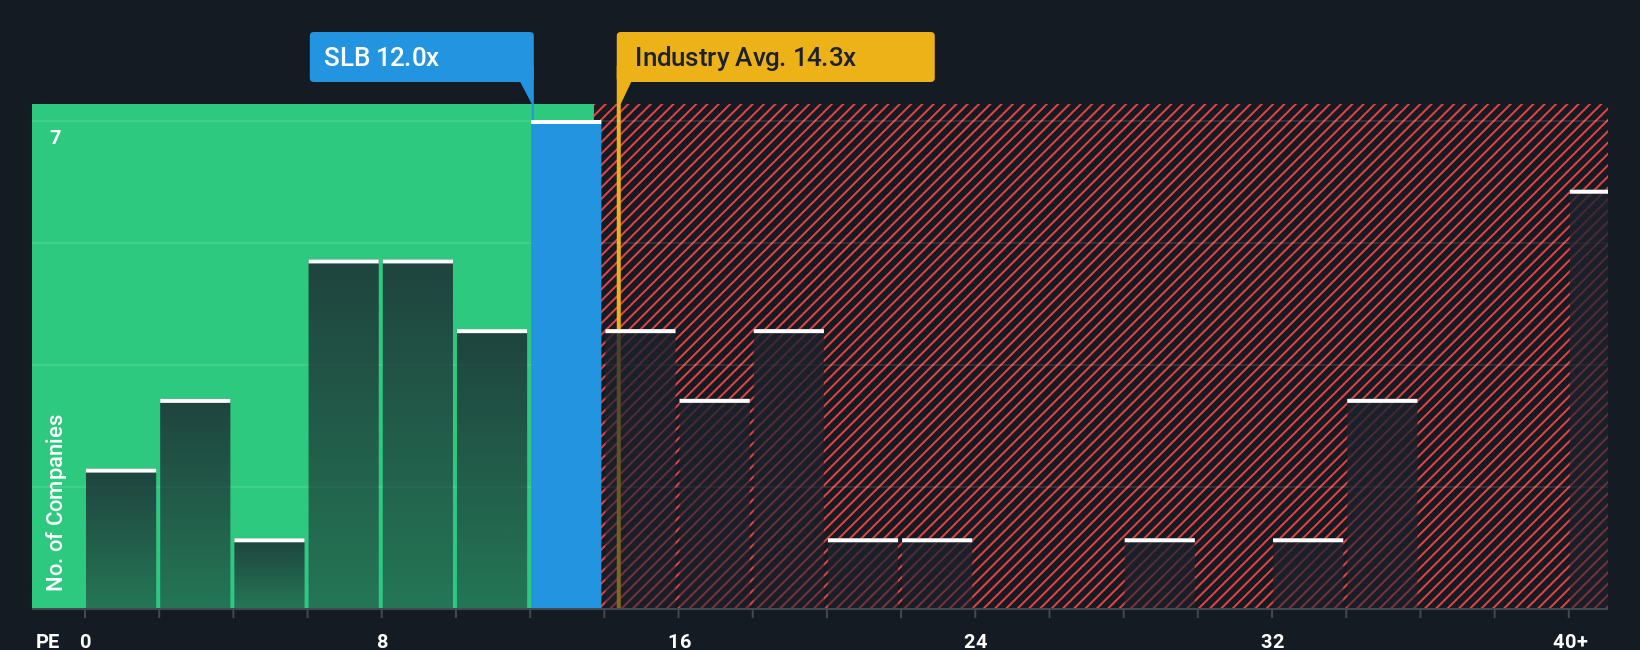
Approach 2: SLB Price vs Earnings
For profitable companies like SLB, the Price to Earnings (PE) ratio is often the cleanest snapshot of how much investors are willing to pay today for each dollar of current earnings. In broad terms, faster and more reliable earnings growth, backed by a solid balance sheet, usually justifies a higher PE, while slower growth or higher risk calls for a lower “normal” multiple.
SLB currently trades on a PE of about 15.9x, which sits below both the Energy Services industry average of roughly 18.4x and the peer group average of around 17.2x. Simply Wall St goes a step further by estimating a proprietary “Fair Ratio” of 20.3x, which reflects what SLB’s PE ought to be given its earnings growth outlook, profitability, risk profile, industry positioning, and market capitalization.
This Fair Ratio is more informative than a simple peer or industry comparison because it adjusts for SLB’s specific fundamentals rather than assuming it should trade like a generic oilfield services stock. With the Fair Ratio of 20.3x sitting meaningfully above the current 15.9x, the multiple analysis indicates that SLB may be undervalued on an earnings basis.
Result: UNDERVALUED
PE ratios tell one story, but what if the real opportunity lies elsewhere? Discover 1446 companies where insiders are betting big on explosive growth.
Upgrade Your Decision Making: Choose your SLB Narrative
Earlier we mentioned that there is an even better way to understand valuation, so let us introduce you to Narratives, a simple framework on Simply Wall St’s Community page where you connect your view of a company’s story to a concrete forecast for its future revenue, earnings and margins, and then to your own Fair Value so you can compare it with today’s share price and decide whether to buy, hold or sell. A Narrative is your personal, numbers backed storyline, and because it lives on the platform used by millions of investors, it is easy to create, update and sense check against others. Narratives also stay dynamic, automatically refreshing when new information like earnings, news or guidance comes in, so your Fair Value view moves with the facts rather than staying frozen. For SLB, one investor might build a bullish Narrative that leans into accelerating digital growth, margin expansion and a Fair Value near $63, while a more cautious investor might emphasize energy transition risks, cyclicality and a Fair Value closer to $36, and both perspectives can coexist and evolve as the data changes.
Do you think there's more to the story for SLB? Head over to our Community to see what others are saying!
This article by Simply Wall St is general in nature. We provide commentary based on historical data and analyst forecasts only using an unbiased methodology and our articles are not intended to be financial advice. It does not constitute a recommendation to buy or sell any stock, and does not take account of your objectives, or your financial situation. We aim to bring you long-term focused analysis driven by fundamental data. Note that our analysis may not factor in the latest price-sensitive company announcements or qualitative material. Simply Wall St has no position in any stocks mentioned.
Have feedback on this article? Concerned about the content? Get in touch with us directly. Alternatively, email editorial-team@simplywallst.com