
 Nasdaq
 華爾街日報
華爾街日報Exor (ENXTAM:EXO) Valuation Check After Recent Share Price Pullback
Exor (ENXTAM:EXO) has quietly slid over the past 3 months, leaving the stock down almost 19% this year even as its diversified portfolio spans autos, agriculture, luxury brands, media and sports.
See our latest analysis for Exor.
The latest slide leaves Exor trading at around $71.9, and while the year to date share price return of negative 19 percent points to fading momentum, the positive three year total shareholder return of about 5 percent suggests longer term holders have still come out ahead.
If this pullback has you rethinking where you deploy capital in autos, it could be a good moment to compare Exor with other auto manufacturers.
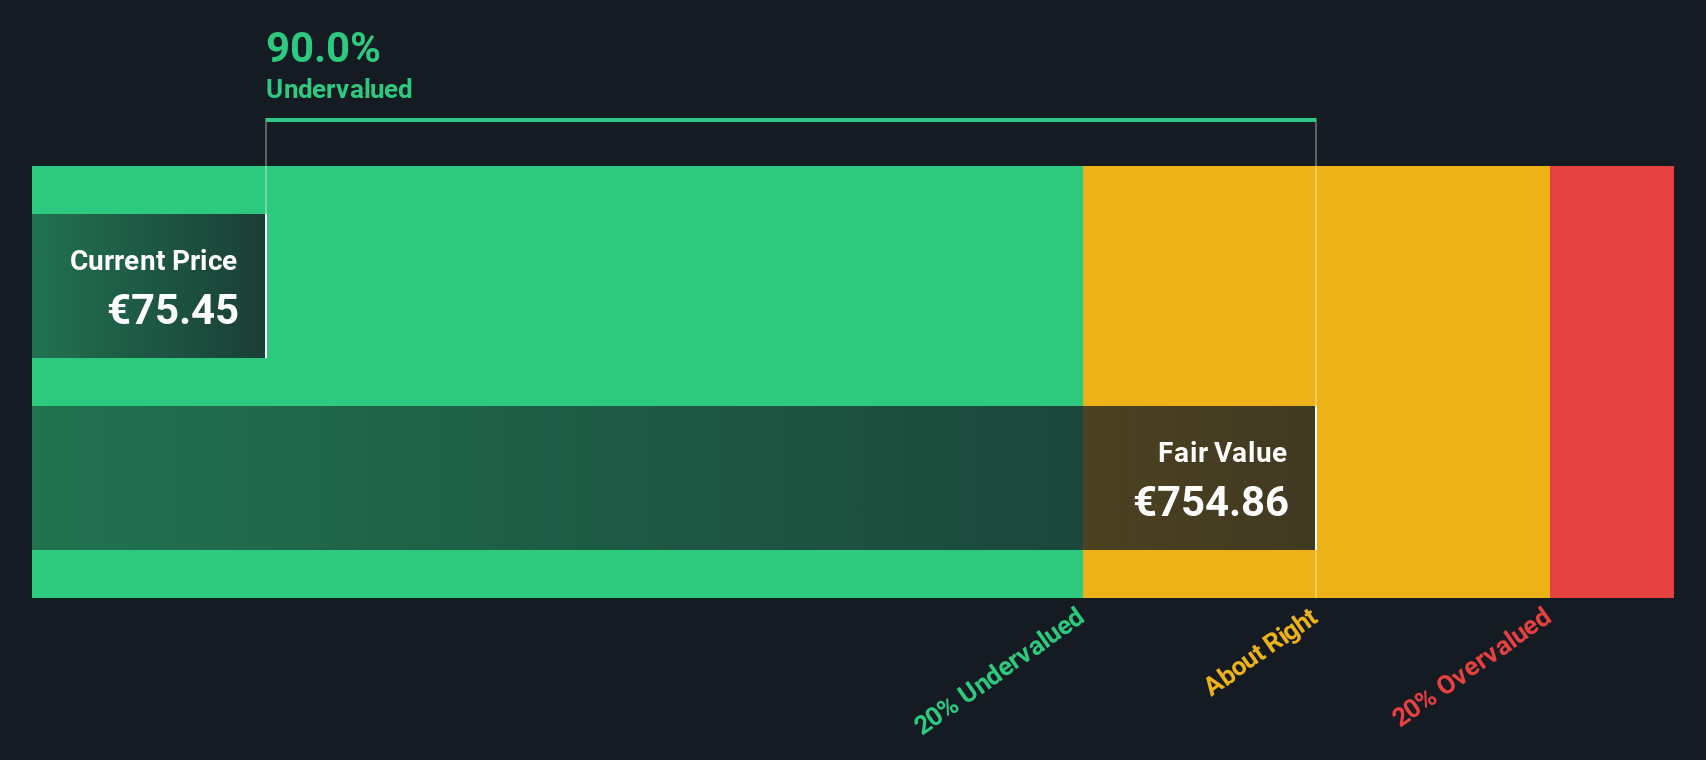
With analysts seeing meaningful upside to the current share price, but market sentiment weighed down by recent losses, the key question is whether Exor is trading at a discount or if future growth is already priced in.
Price to Book of 0.4 times, is it justified?
Exor's last close at €71.9 lines up with a price to book ratio of roughly 0.4 times, a steep discount versus peers and the wider diversified financials space.
The price to book multiple compares the share price with the accounting value of the underlying net assets. This matters for an investment company like Exor, whose portfolio is largely made up of listed holdings and operating businesses that can be benchmarked against market values.
Trading on just 0.4 times book value compared with a 6.1 times peer average and 1 time for the broader European diversified financial industry implies the market is pricing Exor's assets at a deep discount.
With our SWS DCF model suggesting a fair value of about €458.5 per share, the 84.3 percent discount to that estimate reinforces the impression that sentiment around Exor's complex portfolio and current losses may be overshadowing its long term earnings potential rather than any structural deterioration in asset quality.
See what the numbers say about this price — find out in our valuation breakdown.
Result: Price to book of 0.4 times (UNDERVALUED)
However, weak profitability, combined with complex exposure to cyclical autos, luxury and media holdings, could keep the discount entrenched if earnings visibility deteriorates further.
Find out about the key risks to this Exor narrative.
Another way to look at value
Our DCF model paints an even starker picture than the low price to book ratio. It points to fair value around €458.5 per share, or an 84.3 percent discount to today’s price. Is the market misreading Exor’s long term cash generation, or is the model too optimistic?
Look into how the SWS DCF model arrives at its fair value.
Simply Wall St performs a discounted cash flow (DCF) on every stock in the world every day (check out Exor for example). We show the entire calculation in full. You can track the result in your watchlist or portfolio and be alerted when this changes, or use our stock screener to discover 908 undervalued stocks based on their cash flows. If you save a screener we even alert you when new companies match - so you never miss a potential opportunity.
Build Your Own Exor Narrative
If you see the numbers differently or want to dive into the details yourself, you can build a fully tailored view in just minutes: Do it your way.
A great starting point for your Exor research is our analysis highlighting 3 key rewards and 1 important warning sign that could impact your investment decision.
Looking for more investment ideas?
Before markets move without you, put Simply Wall Street to work and quickly uncover fresh opportunities that match your strategy, risk appetite and return goals.
- Explore high-upside potential by targeting early-stage opportunities through these 3612 penny stocks with strong financials that already back their promise with solid financials.
- Focus on structural trends and long-term cash flow strength with these 908 undervalued stocks based on cash flows that may still be flying under the radar.
- Seek to strengthen your income stream by looking for reliable payouts via these 13 dividend stocks with yields > 3% that can support returns even when prices stay flat.
This article by Simply Wall St is general in nature. We provide commentary based on historical data and analyst forecasts only using an unbiased methodology and our articles are not intended to be financial advice. It does not constitute a recommendation to buy or sell any stock, and does not take account of your objectives, or your financial situation. We aim to bring you long-term focused analysis driven by fundamental data. Note that our analysis may not factor in the latest price-sensitive company announcements or qualitative material. Simply Wall St has no position in any stocks mentioned.
Have feedback on this article? Concerned about the content? Get in touch with us directly. Alternatively, email editorial-team@simplywallst.com