
 Nasdaq
 華爾街日報
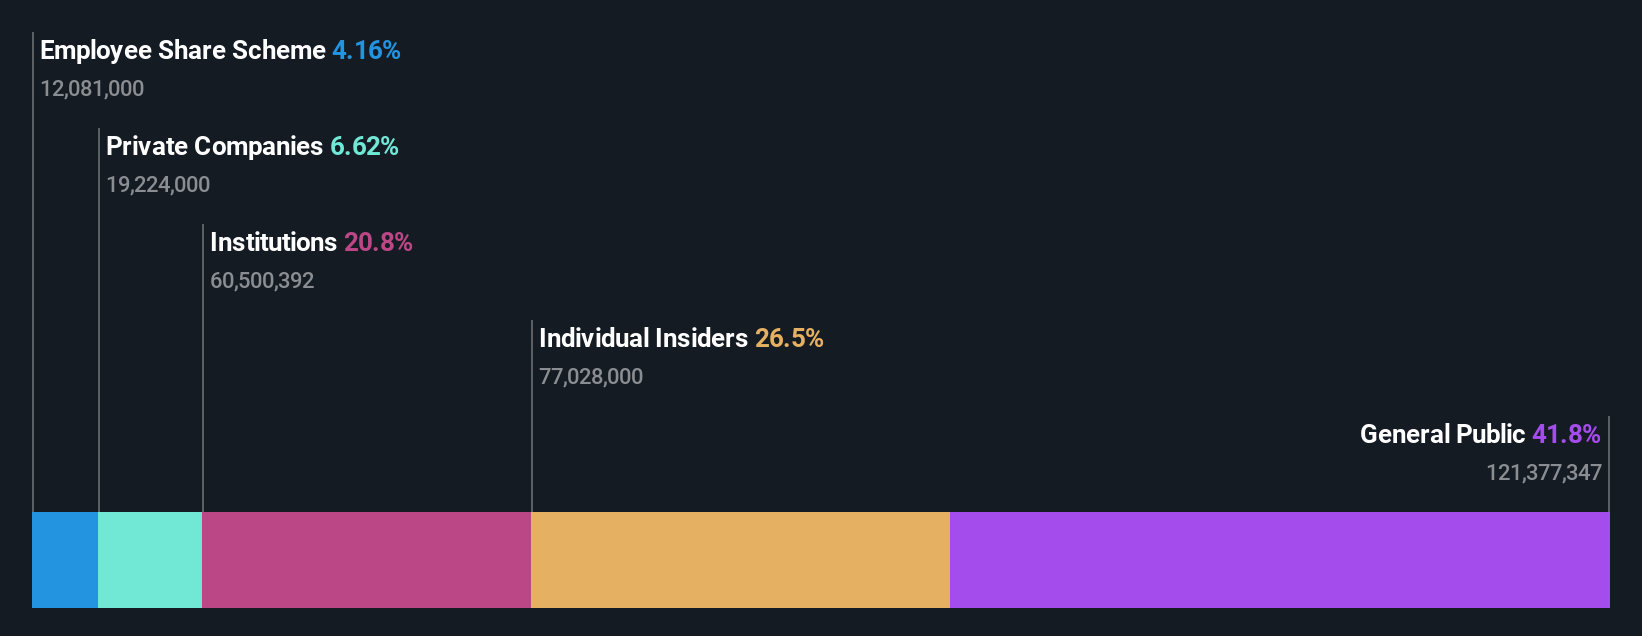
華爾街日報Insiders own 27% of Nojima Corporation (TSE:7419) shares but individual investors control 42% of the company
Key Insights
- Significant control over Nojima by individual investors implies that the general public has more power to influence management and governance-related decisions
- 51% of the business is held by the top 12 shareholders
- Insiders own 27% of Nojima
Every investor in Nojima Corporation (TSE:7419) should be aware of the most powerful shareholder groups. The group holding the most number of shares in the company, around 42% to be precise, is individual investors. That is, the group stands to benefit the most if the stock rises (or lose the most if there is a downturn).
Meanwhile, individual insiders make up 27% of the company’s shareholders. Insiders often own a large chunk of younger, smaller, companies while huge companies tend to have institutions as shareholders.
Let's take a closer look to see what the different types of shareholders can tell us about Nojima.
View our latest analysis for Nojima
What Does The Institutional Ownership Tell Us About Nojima?
Institutions typically measure themselves against a benchmark when reporting to their own investors, so they often become more enthusiastic about a stock once it's included in a major index. We would expect most companies to have some institutions on the register, especially if they are growing.
Nojima already has institutions on the share registry. Indeed, they own a respectable stake in the company. This can indicate that the company has a certain degree of credibility in the investment community. However, it is best to be wary of relying on the supposed validation that comes with institutional investors. They too, get it wrong sometimes. It is not uncommon to see a big share price drop if two large institutional investors try to sell out of a stock at the same time. So it is worth checking the past earnings trajectory of Nojima, (below). Of course, keep in mind that there are other factors to consider, too.

Nojima is not owned by hedge funds. Looking at our data, we can see that the largest shareholder is the CEO Hiroshi Nojima with 18% of shares outstanding. In comparison, the second and third largest shareholders hold about 8.0% and 4.2% of the stock.
After doing some more digging, we found that the top 12 have the combined ownership of 51% in the company, suggesting that no single shareholder has significant control over the company.
While studying institutional ownership for a company can add value to your research, it is also a good practice to research analyst recommendations to get a deeper understand of a stock's expected performance. Our information suggests that there isn't any analyst coverage of the stock, so it is probably little known.
Insider Ownership Of Nojima
The definition of company insiders can be subjective and does vary between jurisdictions. Our data reflects individual insiders, capturing board members at the very least. Company management run the business, but the CEO will answer to the board, even if he or she is a member of it.
Most consider insider ownership a positive because it can indicate the board is well aligned with other shareholders. However, on some occasions too much power is concentrated within this group.
It seems insiders own a significant proportion of Nojima Corporation. Insiders own JP¥90b worth of shares in the JP¥339b company. That's quite meaningful. Most would be pleased to see the board is investing alongside them. You may wish to access this free chart showing recent trading by insiders.
General Public Ownership
The general public-- including retail investors -- own 42% stake in the company, and hence can't easily be ignored. While this size of ownership may not be enough to sway a policy decision in their favour, they can still make a collective impact on company policies.
Private Company Ownership
It seems that Private Companies own 6.6%, of the Nojima stock. It might be worth looking deeper into this. If related parties, such as insiders, have an interest in one of these private companies, that should be disclosed in the annual report. Private companies may also have a strategic interest in the company.
Next Steps:
While it is well worth considering the different groups that own a company, there are other factors that are even more important. For example, we've discovered 1 warning sign for Nojima that you should be aware of before investing here.
Of course, you might find a fantastic investment by looking elsewhere. So take a peek at this free list of interesting companies.
NB: Figures in this article are calculated using data from the last twelve months, which refer to the 12-month period ending on the last date of the month the financial statement is dated. This may not be consistent with full year annual report figures.
Have feedback on this article? Concerned about the content? Get in touch with us directly. Alternatively, email editorial-team (at) simplywallst.com.
This article by Simply Wall St is general in nature. We provide commentary based on historical data and analyst forecasts only using an unbiased methodology and our articles are not intended to be financial advice. It does not constitute a recommendation to buy or sell any stock, and does not take account of your objectives, or your financial situation. We aim to bring you long-term focused analysis driven by fundamental data. Note that our analysis may not factor in the latest price-sensitive company announcements or qualitative material. Simply Wall St has no position in any stocks mentioned.