
 Nasdaq
 華爾街日報
華爾街日報PJT Partners (PJT): Has the Recent Slowdown in Momentum Changed the Valuation Story?
PJT Partners (PJT) has quietly outperformed over the past year, with shares up about 4% and a strong 3 year total return above 130%. This raises fresh questions about whether the investment bank still looks reasonably priced.
See our latest analysis for PJT Partners.
The share price has drifted a little over the past quarter but still sits at around $170.03. That modest near term share price weakness contrasts with a much stronger three year total shareholder return, suggesting momentum has cooled without erasing the longer term uptrend.
If PJT's run has you rethinking where growth and quality might show up next, it is worth scanning fast growing stocks with high insider ownership as a way to spot other under the radar opportunities.
With the share price hovering just below analyst targets after years of strong gains, the key question now is whether PJT Partners is still trading below its true worth or whether markets are already pricing in the next leg of growth.
Price-to-Earnings of 23.2x: Is it justified?
On a price-to-earnings ratio of 23.2x at the last close of $170.03, PJT Partners looks slightly cheaper than the broader US capital markets industry, but more expensive than its immediate peer set. This hints that investors are paying up selectively for its earnings profile.
The price to earnings multiple compares the current share price to per share earnings. This makes it a natural fit for a mature, profitable advisory firm like PJT. For capital markets businesses, it is a quick shorthand for how much the market is willing to pay today for each dollar of current profit, and it embeds expectations about how durable and repeatable those profits will be.
Here, the 23.2x price to earnings sits below the industry average of 25.2x, which implies the market is not assigning a premium relative to the wider capital markets group. However, compared with a peer average of 16.3x, PJT does command a clear valuation uplift, suggesting investors are baking in stronger profitability, quality of earnings or a more resilient growth path than many of its closer comparables.
See what the numbers say about this price — find out in our valuation breakdown.
Result: Price-to-Earnings of 23.2x (ABOUT RIGHT)
However, slower advisory mandates and any setback in restructuring activity could quickly pressure earnings and challenge the premium multiple investors currently grant PJT.
Find out about the key risks to this PJT Partners narrative.
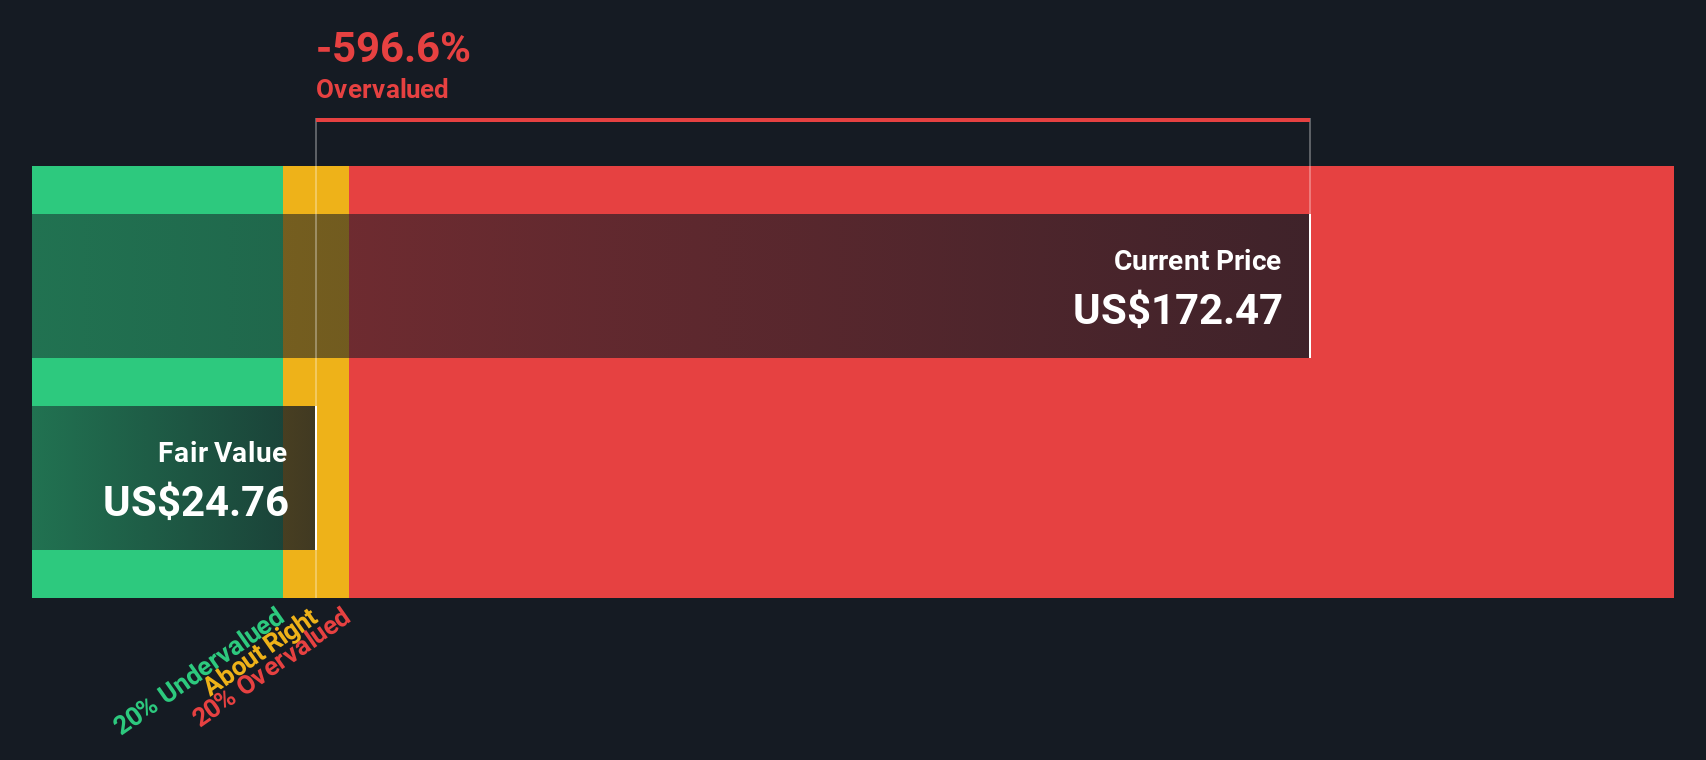
Another View, DCF Flags a Very Different Story
While the price to earnings ratio suggests PJT Partners is roughly in line with the wider capital markets group, our DCF model presents a sharper picture of downside risk. It indicates the stock trades well above an estimated fair value of $81.59, raising the question of what could happen if earnings momentum fades.
Look into how the SWS DCF model arrives at its fair value.
Simply Wall St performs a discounted cash flow (DCF) on every stock in the world every day (check out PJT Partners for example). We show the entire calculation in full. You can track the result in your watchlist or portfolio and be alerted when this changes, or use our stock screener to discover 908 undervalued stocks based on their cash flows. If you save a screener we even alert you when new companies match - so you never miss a potential opportunity.
Build Your Own PJT Partners Narrative
If you would rather challenge these assumptions or dig into the numbers yourself, you can build a personalised view in just a few minutes: Do it your way.
A good starting point is our analysis highlighting 2 key rewards investors are optimistic about regarding PJT Partners.
Ready for more investment ideas?
If PJT has sharpened your appetite for opportunity, do not stop here. Use the Simply Wall Street Screener to pinpoint your next high conviction ideas today.
- Explore early stage opportunities through these 3611 penny stocks with strong financials that already show real financial substance.
- Focus on these 26 AI penny stocks that are positioned to benefit from data driven demand.
- Identify potential bargains by looking at these 908 undervalued stocks based on cash flows where cash flows suggest possible mispricing.
This article by Simply Wall St is general in nature. We provide commentary based on historical data and analyst forecasts only using an unbiased methodology and our articles are not intended to be financial advice. It does not constitute a recommendation to buy or sell any stock, and does not take account of your objectives, or your financial situation. We aim to bring you long-term focused analysis driven by fundamental data. Note that our analysis may not factor in the latest price-sensitive company announcements or qualitative material. Simply Wall St has no position in any stocks mentioned.
Have feedback on this article? Concerned about the content? Get in touch with us directly. Alternatively, email editorial-team@simplywallst.com