
 Nasdaq
 華爾街日報
華爾街日報Has Ciena’s 160% Surge in 2025 Already Priced In AI Infrastructure Hopes?
- If you are wondering whether Ciena’s huge run up still leaves any value on the table, or if you are late to the party, this breakdown will help you decide whether the stock still stacks up against its fundamentals.
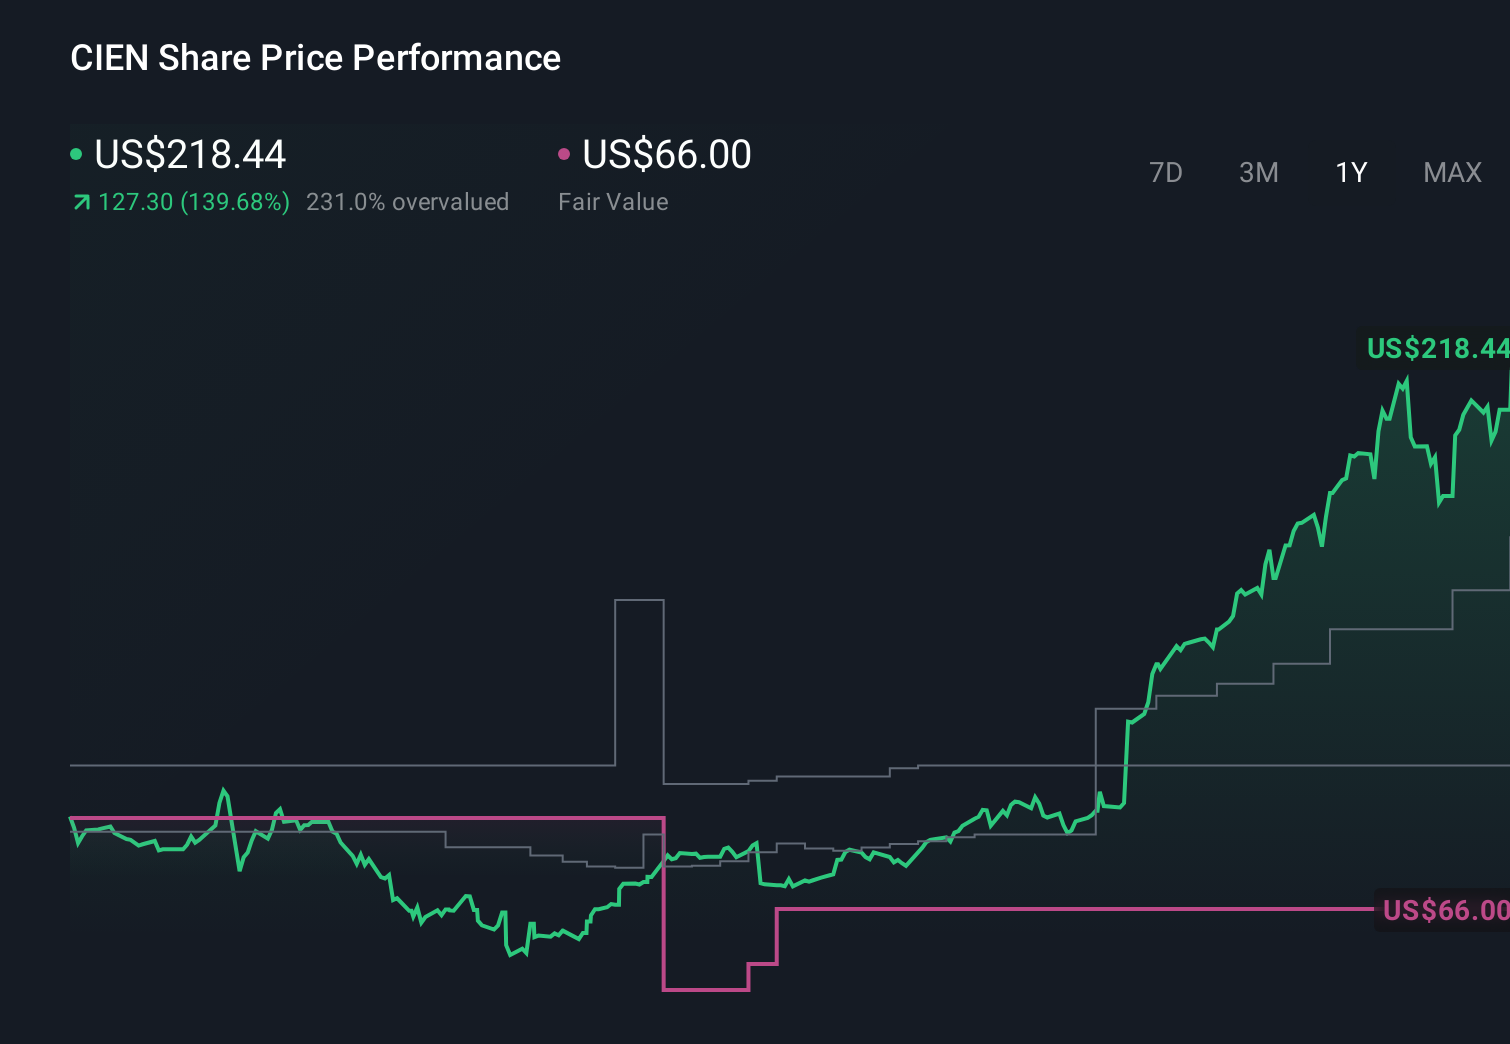
- Ciena has climbed 1.5% over the last week and 12.8% over the past month, while racking up a 159.7% gain year to date and 137.2% over the last year, putting it firmly in the spotlight for momentum focused investors.
- Much of this strength has been underpinned by growing enthusiasm for networking and optical infrastructure names, with investors rotating into companies viewed as key beneficiaries of AI driven data demand and global bandwidth upgrades. Sector news around increased capex from major cloud and telecom players has reinforced the idea that Ciena could be a structural winner rather than just a short term trade.
- Despite the surge in interest, Ciena only scores 1/6 on our valuation checks, suggesting it screens as undervalued on just one of six measures. In the sections that follow we will walk through what different valuation methods say about the stock, and then finish by exploring a more holistic way to think about its true worth.
Ciena scores just 1/6 on our valuation checks. See what other red flags we found in the full valuation breakdown.
Approach 1: Ciena Discounted Cash Flow (DCF) Analysis
A Discounted Cash Flow model estimates what a company is worth by projecting its future cash flows and then discounting them back to today’s value, using a required rate of return. For Ciena, the latest twelve month Free Cash Flow stands at roughly $667.6 Million, forming the base for these projections.
Analysts and extrapolated estimates suggest Ciena’s Free Cash Flow could rise to about $684 Million by 2030, with intermediate years fluctuating between roughly $479 Million and $952 Million as demand for networking infrastructure evolves. Simply Wall St applies a 2 Stage Free Cash Flow to Equity model, using detailed analyst forecasts for the earlier years and then tapering growth to more modest rates further out.
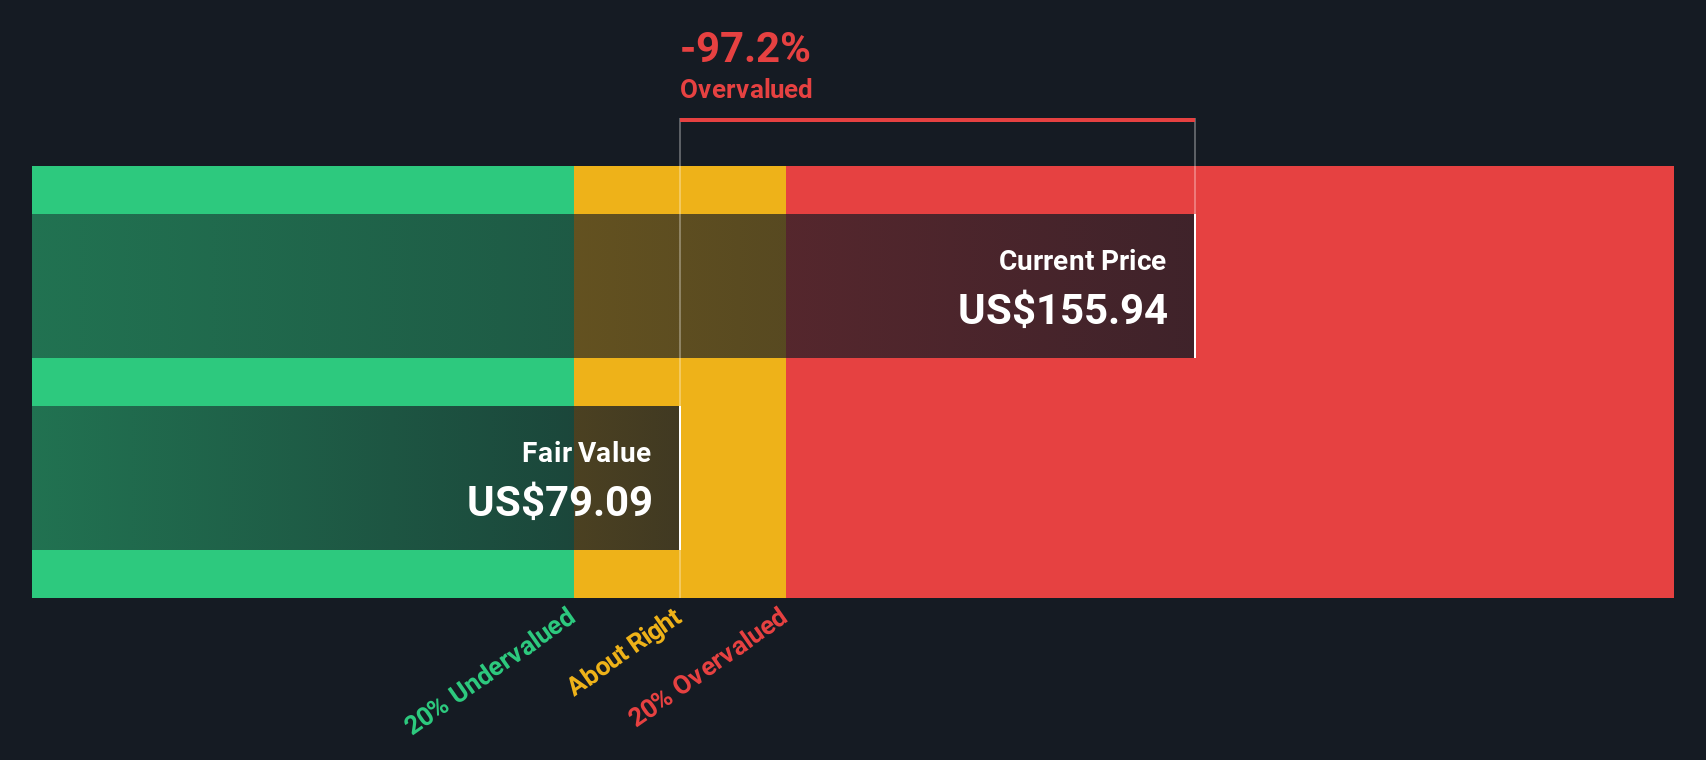
Aggregating and discounting these future cash flows leads to an estimated intrinsic value of about $79.45 per share. With the model implying the stock is roughly 172.1% overvalued relative to its current trading price, the DCF view suggests that a lot of future growth is already priced in and that this leaves a limited margin of safety for new buyers.
Result: OVERVALUED
Our Discounted Cash Flow (DCF) analysis suggests Ciena may be overvalued by 172.1%. Discover 908 undervalued stocks or create your own screener to find better value opportunities.
Approach 2: Ciena Price vs Sales
For a profitable, growing business like Ciena, the price to sales ratio is a useful way to compare what investors are willing to pay for each dollar of revenue, especially in industries where margins and earnings can swing with investment cycles. In general, faster growth and lower perceived risk justify a higher sales multiple, while slower or more volatile businesses tend to trade on lower ratios.
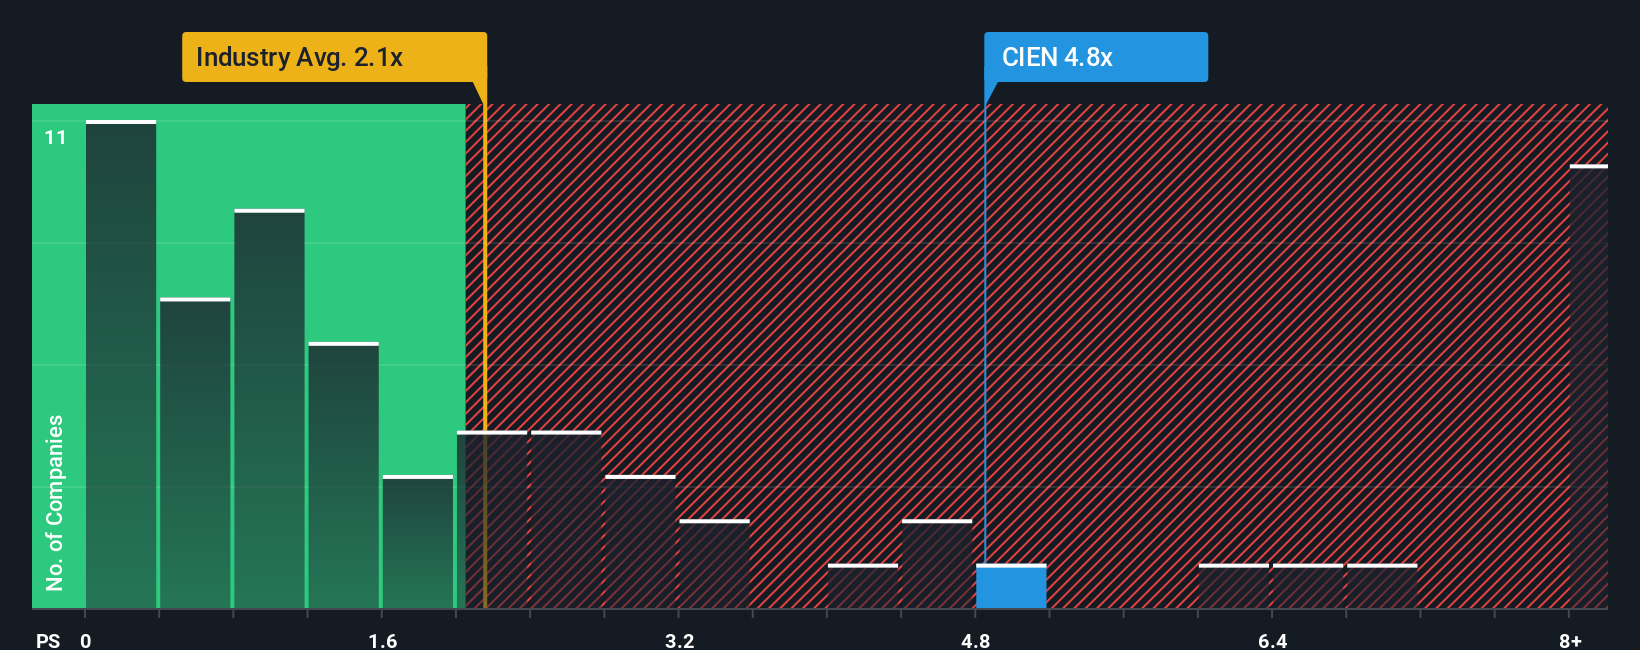
Ciena currently trades on a price to sales ratio of 6.39x, which is well above the broader Communications industry average of 1.92x, but below the peer group average of 8.85x. To move beyond these blunt comparisons, Simply Wall St estimates a Fair Ratio of 4.61x, a proprietary sales multiple that reflects Ciena’s specific growth outlook, profitability profile, risk factors, industry positioning and market cap. Because it is tailored to the company rather than just its sector, the Fair Ratio provides a more grounded yardstick than peers or industry averages alone.
Comparing Ciena’s actual 6.39x price to sales ratio with the 4.61x Fair Ratio suggests the stock is trading at a premium to what its fundamentals would typically warrant.
Result: OVERVALUED
PS ratios tell one story, but what if the real opportunity lies elsewhere? Discover 1446 companies where insiders are betting big on explosive growth.
Upgrade Your Decision Making: Choose your Ciena Narrative
Earlier we mentioned that there is an even better way to understand valuation, so let us introduce you to Narratives, a simple way to connect your view of Ciena’s story with a concrete forecast for its future revenue, earnings and margins, and then translate that into your own Fair Value. On Simply Wall St’s Community page, used by millions of investors, a Narrative is your personal storyline for the company, where you set assumptions, see what Fair Value they imply, and compare that to the current share price to decide if Ciena looks buyable, hold worthy or ready to sell. Because Narratives update dynamically when new information like earnings, news or analyst revisions arrive, they give you a living framework rather than a static target. For example, one Ciena Narrative might assume AI driven optical demand stays very strong and justify a Fair Value near $167, while a more cautious Narrative could anchor closer to the low analyst target around $79. The gap between your Fair Value and today’s price then becomes a clear signal on what actions you might consider next.
Do you think there's more to the story for Ciena? Head over to our Community to see what others are saying!
This article by Simply Wall St is general in nature. We provide commentary based on historical data and analyst forecasts only using an unbiased methodology and our articles are not intended to be financial advice. It does not constitute a recommendation to buy or sell any stock, and does not take account of your objectives, or your financial situation. We aim to bring you long-term focused analysis driven by fundamental data. Note that our analysis may not factor in the latest price-sensitive company announcements or qualitative material. Simply Wall St has no position in any stocks mentioned.
Have feedback on this article? Concerned about the content? Get in touch with us directly. Alternatively, email editorial-team@simplywallst.com