
 Nasdaq
 華爾街日報
華爾街日報Is Amazon Still Attractively Priced After Its Recent AI and Cloud Expansion Strategy?
- If you are wondering whether Amazon.com is still a smart buy at today’s price or if most of the upside is already baked in, you are not alone. This breakdown will unpack that debate in detail.
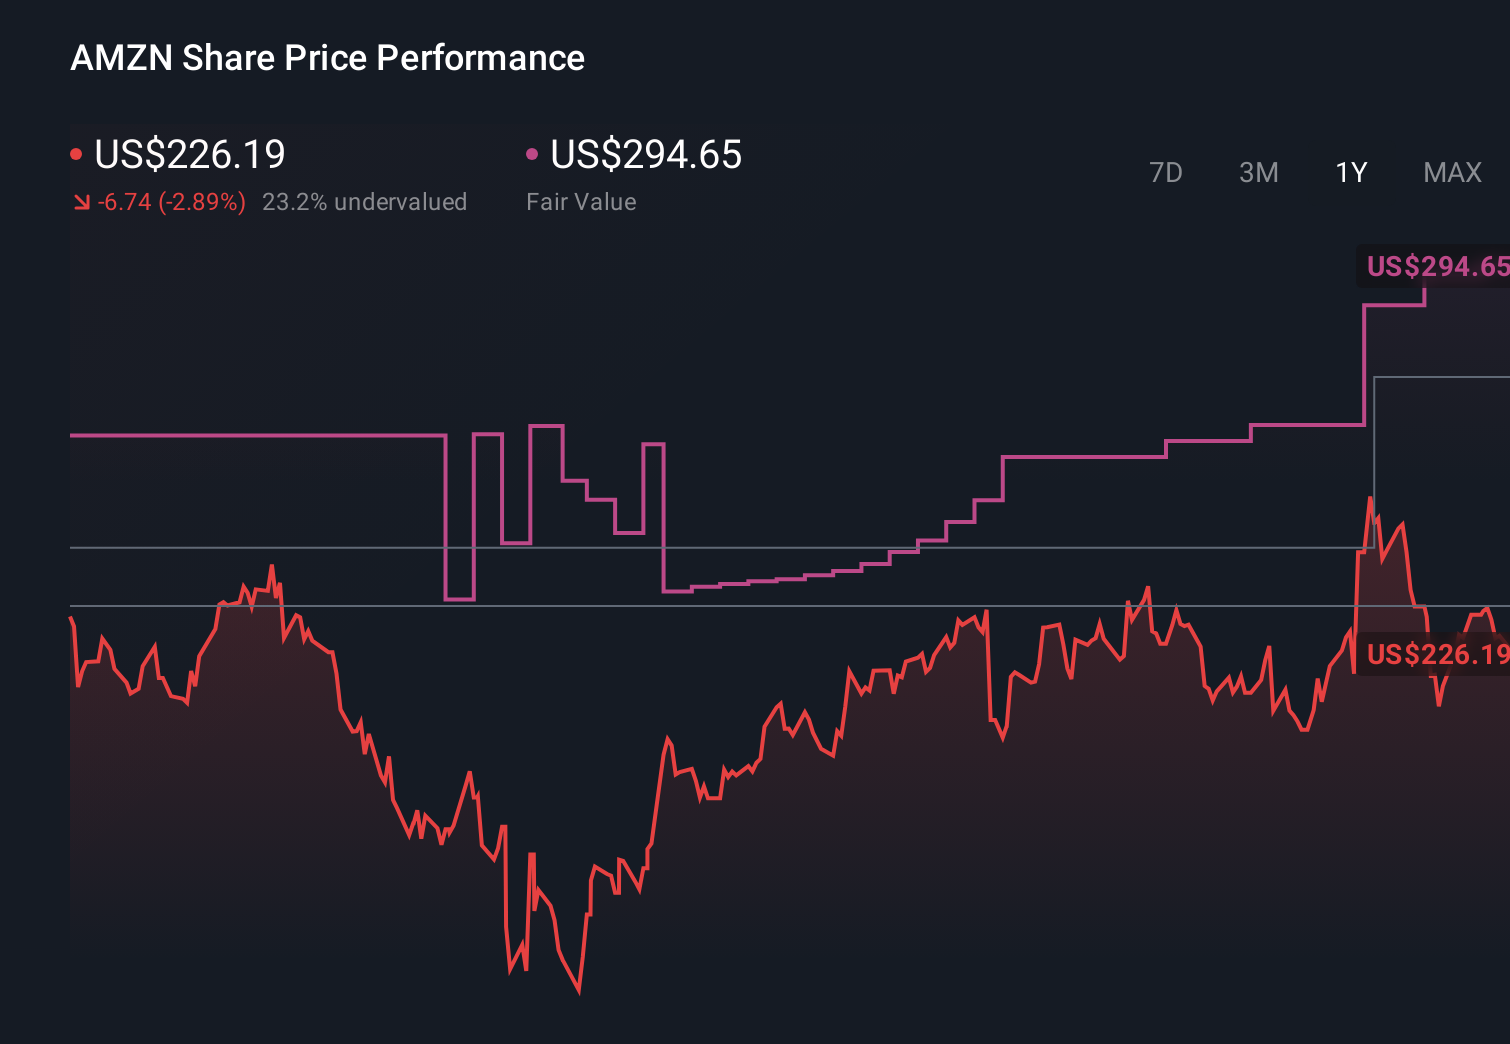
- Despite a modest 2.7% gain year to date and a 1 year slip of 2.9%, the stock is still up an impressive 166.4% over 3 years. This pattern keeps investors debating whether this is a pause or a reset in expectations.
- Recent headlines have focused on Amazon’s push into AI infrastructure and cloud services, along with continued investment in logistics and advertising. These moves reinforce its ambition to remain at the center of digital commerce and computing. At the same time, regulatory scrutiny, shifting consumer trends, and heavier competition in key segments have added nuance to how the market prices that growth story.
- Right now, Amazon.com scores a solid 5/6 valuation check score on our framework, suggesting it screens as undervalued on most of the key metrics tracked. Next, this breakdown will walk through those valuation methods one by one and then close with a more holistic way to judge whether the current price matches Amazon’s long term potential.
Find out why Amazon.com's -2.9% return over the last year is lagging behind its peers.
Approach 1: Amazon.com Discounted Cash Flow (DCF) Analysis
A Discounted Cash Flow, or DCF, model estimates what a company is worth today by projecting the cash it can generate in the future and discounting those cash flows back to the present.
For Amazon.com, the model starts with last twelve months free cash flow of about $40.0 billion. Analysts then project this to rise sharply, with Simply Wall St extending their estimates beyond the usual 5 year window. By 2029, free cash flow is expected to reach roughly $142.1 billion, and the full 10 year path of projected cash flows is used in a 2 stage Free Cash Flow to Equity framework.
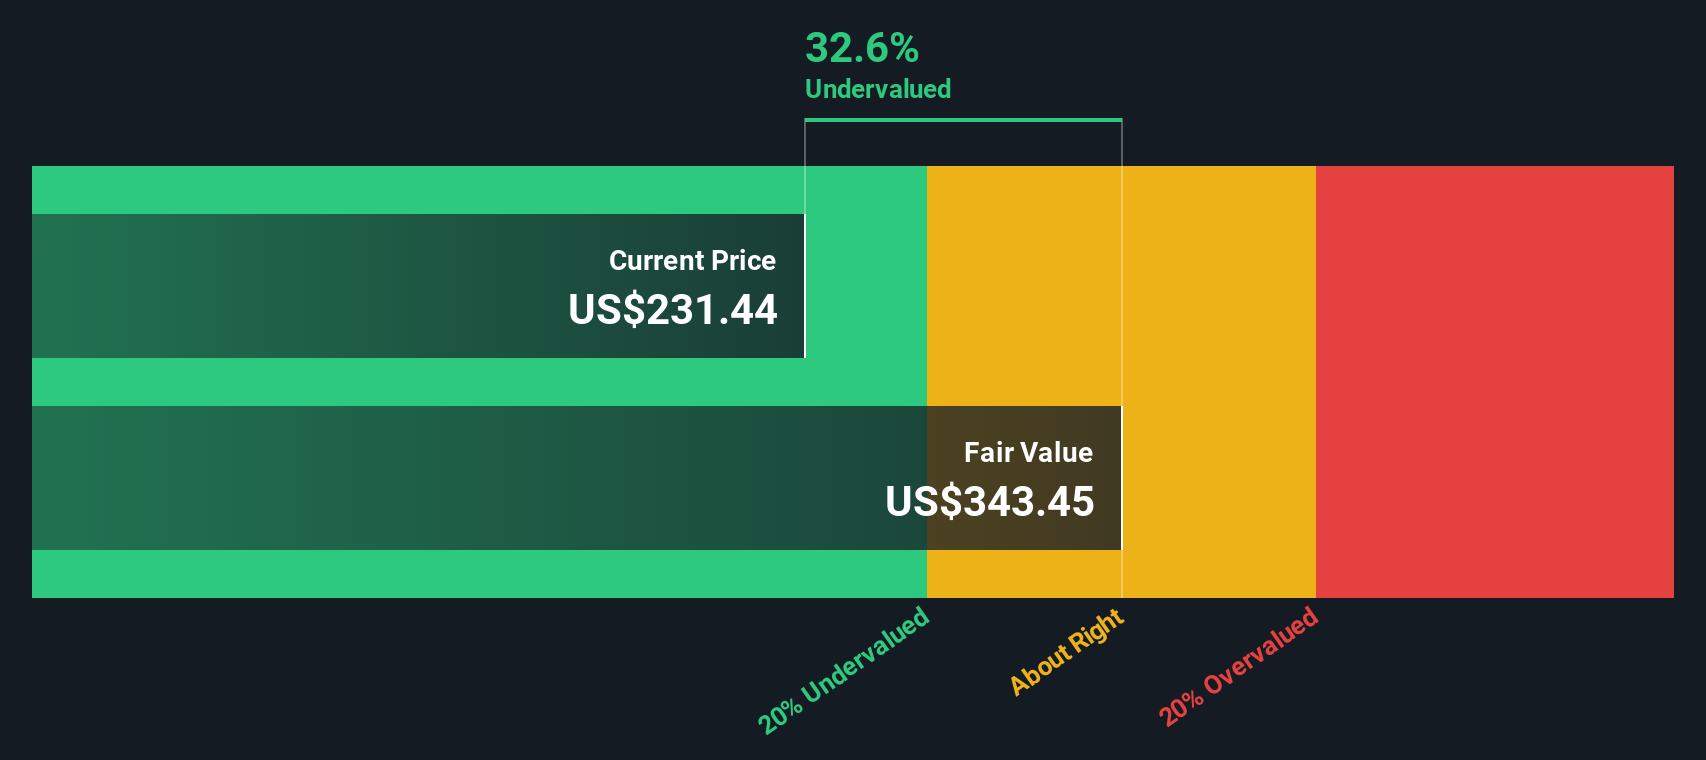
When all those future cash flows are discounted back, the DCF model arrives at an intrinsic value of about $305.93 per share. Compared with the current market price, this implies the stock is trading at roughly a 26.1% discount, indicating a gap between the model’s valuation and current pricing.
Result: UNDERVALUED
Our Discounted Cash Flow (DCF) analysis suggests Amazon.com is undervalued by 26.1%. Track this in your watchlist or portfolio, or discover 910 more undervalued stocks based on cash flows.
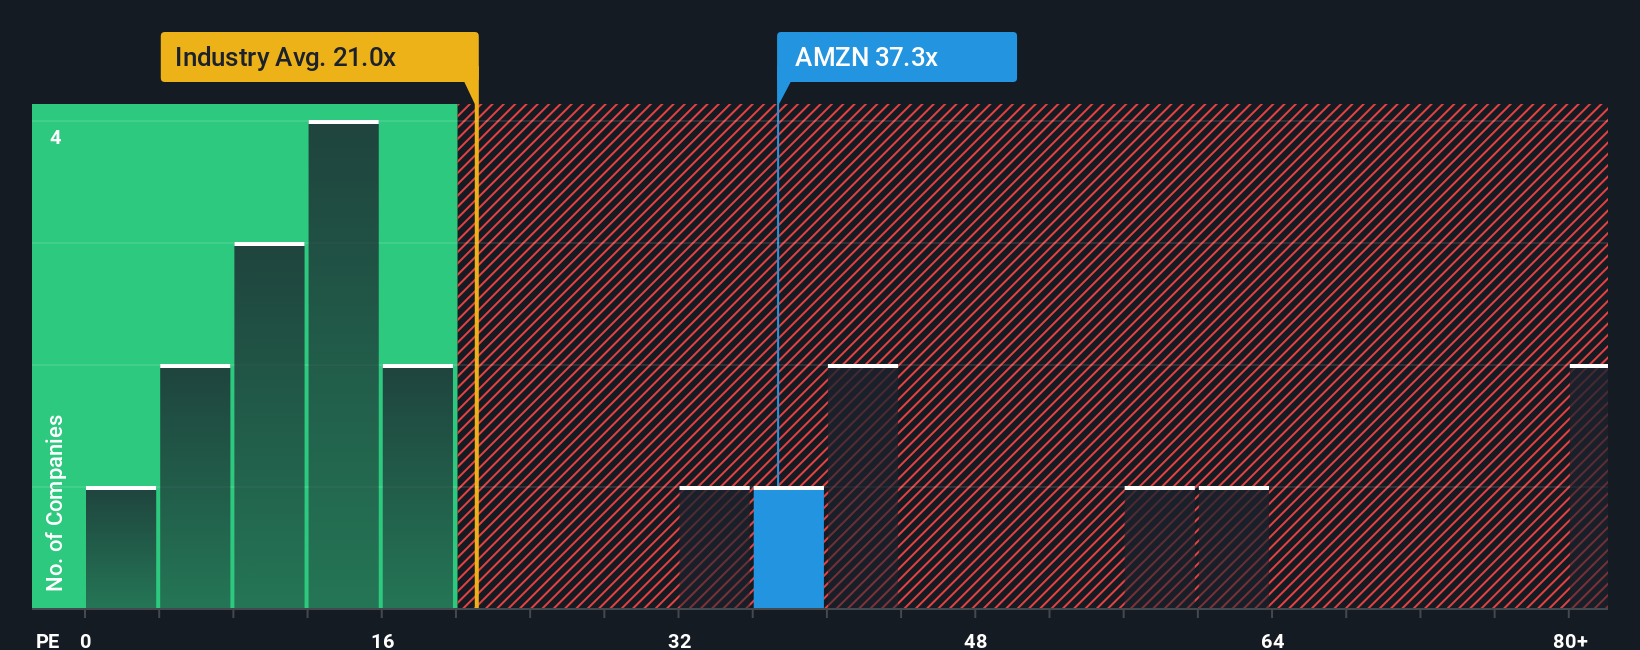
Approach 2: Amazon.com Price vs Earnings
For a profitable, large cap business like Amazon.com, the price to earnings, or PE, ratio is a useful way to judge how much investors are willing to pay today for each dollar of current earnings. In general, companies with stronger growth and lower perceived risk tend to justify a higher, or more expensive, PE multiple, while slower growing or riskier businesses usually trade on lower multiples.
Amazon currently trades on a PE of about 31.6x. That is comfortably above the broader Multiline Retail industry average of roughly 19.7x, but slightly below the peer group average near 33.0x, which already reflects the market’s expectations for faster growth and durable competitive advantages. To go a step further, Simply Wall St calculates a proprietary Fair Ratio of around 40.1x for Amazon, which estimates the PE the stock should trade at after factoring in its earnings growth outlook, profitability, industry, market cap and risk profile.
This Fair Ratio is more tailored than simple peer or industry comparisons because it adjusts for Amazon’s specific strengths and risks rather than assuming all retailers deserve the same multiple. With the shares at 31.6x compared with a Fair Ratio of 40.1x, the stock screens as undervalued on this metric.
Result: UNDERVALUED
PE ratios tell one story, but what if the real opportunity lies elsewhere? Discover 1446 companies where insiders are betting big on explosive growth.
Upgrade Your Decision Making: Choose your Amazon.com Narrative
Earlier we mentioned that there is an even better way to understand valuation, so let us introduce you to Narratives, which are simply your own story about a company that connects what it does, how you think its revenues, earnings and margins will evolve, and what you believe is a fair value today.
On Simply Wall St, Narratives live inside the Community page and turn this story into a structured forecast. They link your assumptions about Amazon.com’s business drivers to a clear financial model and a single Fair Value number that you can easily compare with the current share price to help you decide whether it is a buy, hold or sell for you.
Narratives on the platform are dynamic. They automatically update when fresh information arrives, such as new earnings, guidance or major news, helping your valuation stay aligned with reality instead of going stale.
For Amazon.com specifically, some investors build cautious Narratives that point to Fair Values near $217.95, while others construct more optimistic stories that support Fair Values close to $295.53. This shows how different yet reasonable views on AWS growth, advertising margins and AI investment can all be expressed quantitatively and compared in one place.
For Amazon.com however we will make it really easy for you with previews of two leading Amazon.com Narratives:
Fair value: $234.75
Implied undervaluation vs last close: -3.6%
Revenue growth assumption: 13.6%
- Sees recent share price weakness after 2Q25 as a potential opportunity for investors, with Amazon’s leadership in e commerce, AWS and advertising underpinning long term compounding.
- Highlights strong execution in core metrics, including double digit net sales growth across regions, record Prime Day, an expanding AWS customer list and substantial AI and data center capital expenditure.
- Projects a conservative Fair Value near $234.75 over a 5 to 10 year horizon, arguing that pipeline projects and AI initiatives are not fully reflected in the base case forecasts.
Fair value: $222.55
Implied overvaluation vs last close: 1.6%
Revenue growth assumption: 15.19%
- Recognises Amazon’s earnings engine from 3P sellers, AWS and advertising, but argues that heavy reinvestment may keep free cash flow suppressed in the near term.
- Builds segment by segment assumptions for online retail, 3P, AWS, advertising, subscriptions and physical stores, concluding that today’s price already reflects strong long run growth.
- Flags regulatory pressure and macro slowdowns as key risks that could affect revenue and margin expansion, leading to a Fair Value around $222.55 and suggesting the stock is close to fairly valued at current levels.
Do you think there's more to the story for Amazon.com? Head over to our Community to see what others are saying!
This article by Simply Wall St is general in nature. We provide commentary based on historical data and analyst forecasts only using an unbiased methodology and our articles are not intended to be financial advice. It does not constitute a recommendation to buy or sell any stock, and does not take account of your objectives, or your financial situation. We aim to bring you long-term focused analysis driven by fundamental data. Note that our analysis may not factor in the latest price-sensitive company announcements or qualitative material. Simply Wall St has no position in any stocks mentioned.
Have feedback on this article? Concerned about the content? Get in touch with us directly. Alternatively, email editorial-team@simplywallst.com