
 Nasdaq
 華爾街日報
華爾街日報Weighing XPeng’s Valuation After Recent Share Price Swings in 2025
- Considering whether XPeng remains a smart way to gain exposure to the EV story, or whether the recent run makes it too risky at today's price.
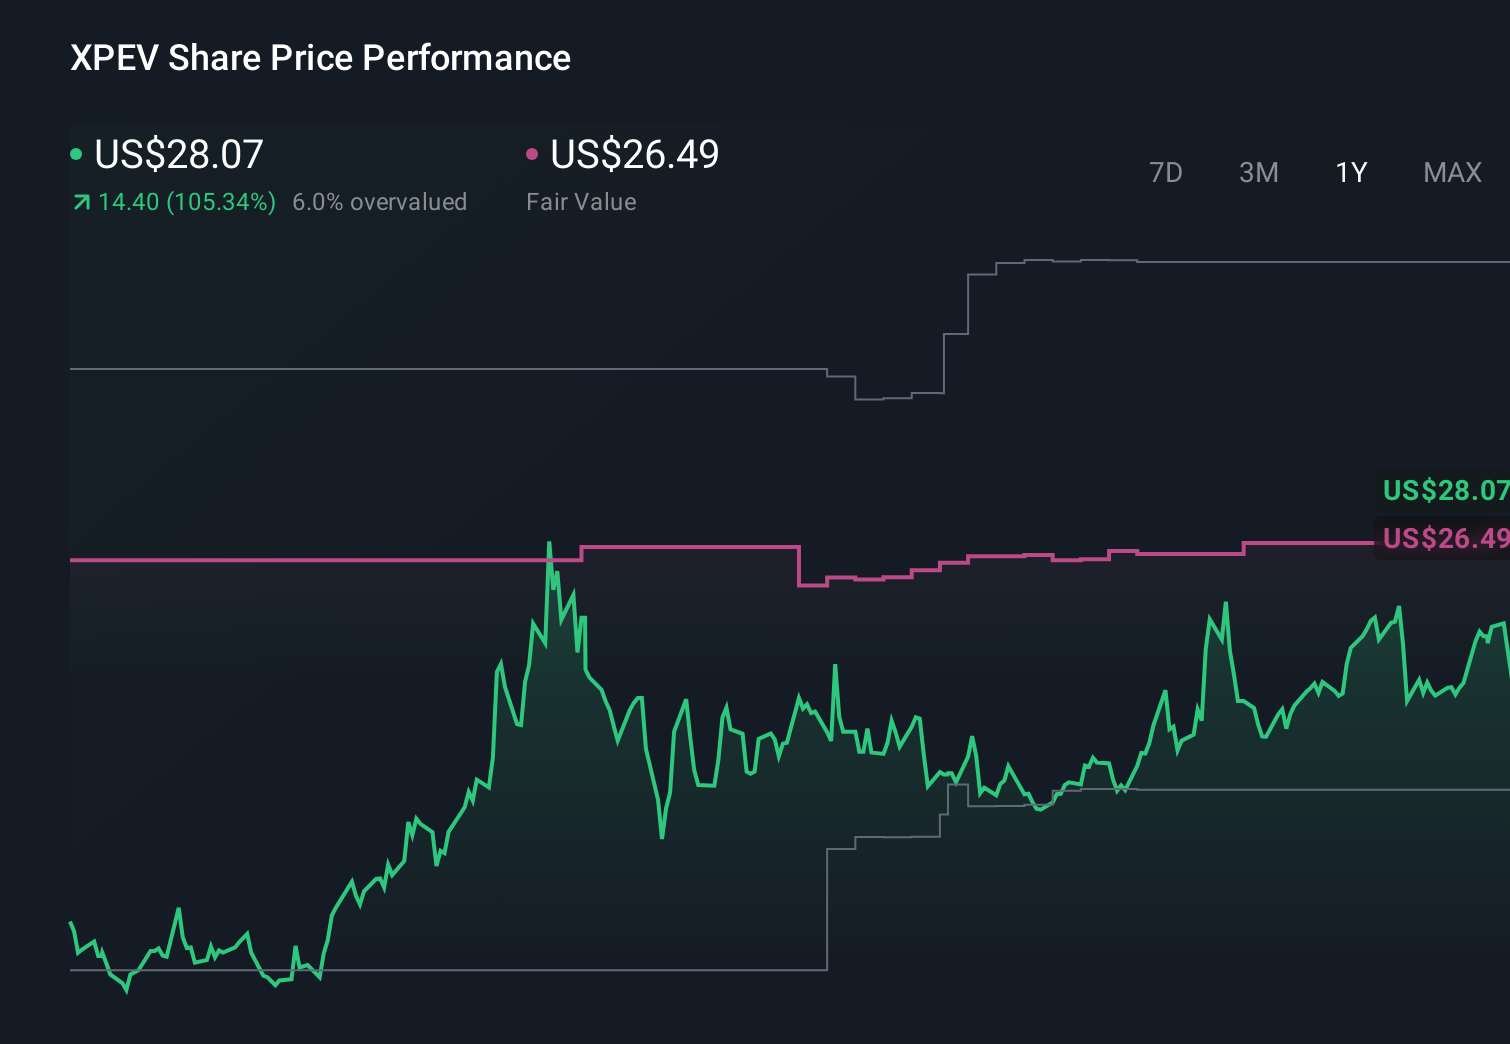
- The stock is down 7.5% over the last week and 24.1% over the last month, but it is still up 64.4% year to date and 53.3% over the last year, reminding investors how quickly sentiment around this name can swing.
- Recent headlines have focused on XPeng’s push to scale its smart EV lineup and deepen technology partnerships, as it tries to stand out in an increasingly crowded Chinese EV market. At the same time, ongoing discussion about global EV demand, pricing pressure, and regulatory uncertainty has kept volatility high, which helps explain the choppy share price.
- In our framework, XPeng scores just 2 out of 6 on undervaluation checks. Next we will look at what different valuation methods are indicating and, by the end of the article, explore another way to think about what the stock might be worth.
XPeng scores just 2/6 on our valuation checks. See what other red flags we found in the full valuation breakdown.
Approach 1: XPeng Discounted Cash Flow (DCF) Analysis
A Discounted Cash Flow model estimates what a company is worth by projecting the cash it can generate in the future and discounting those cash flows back to today. For XPeng, the 2 Stage Free Cash Flow to Equity model starts from last twelve month free cash flow of about CN¥5.1 billion outflow, reflecting heavy investment and operating losses.
Analysts see XPeng swinging into positive territory over the next few years, with free cash flow projected to reach roughly CN¥8.2 billion by 2026 and CN¥10.5 billion by 2027. Beyond the explicit analyst horizon, Simply Wall St extrapolates growth, with free cash flow potentially rising to around CN¥20.1 billion by 2035, though these longer term figures are naturally more uncertain.
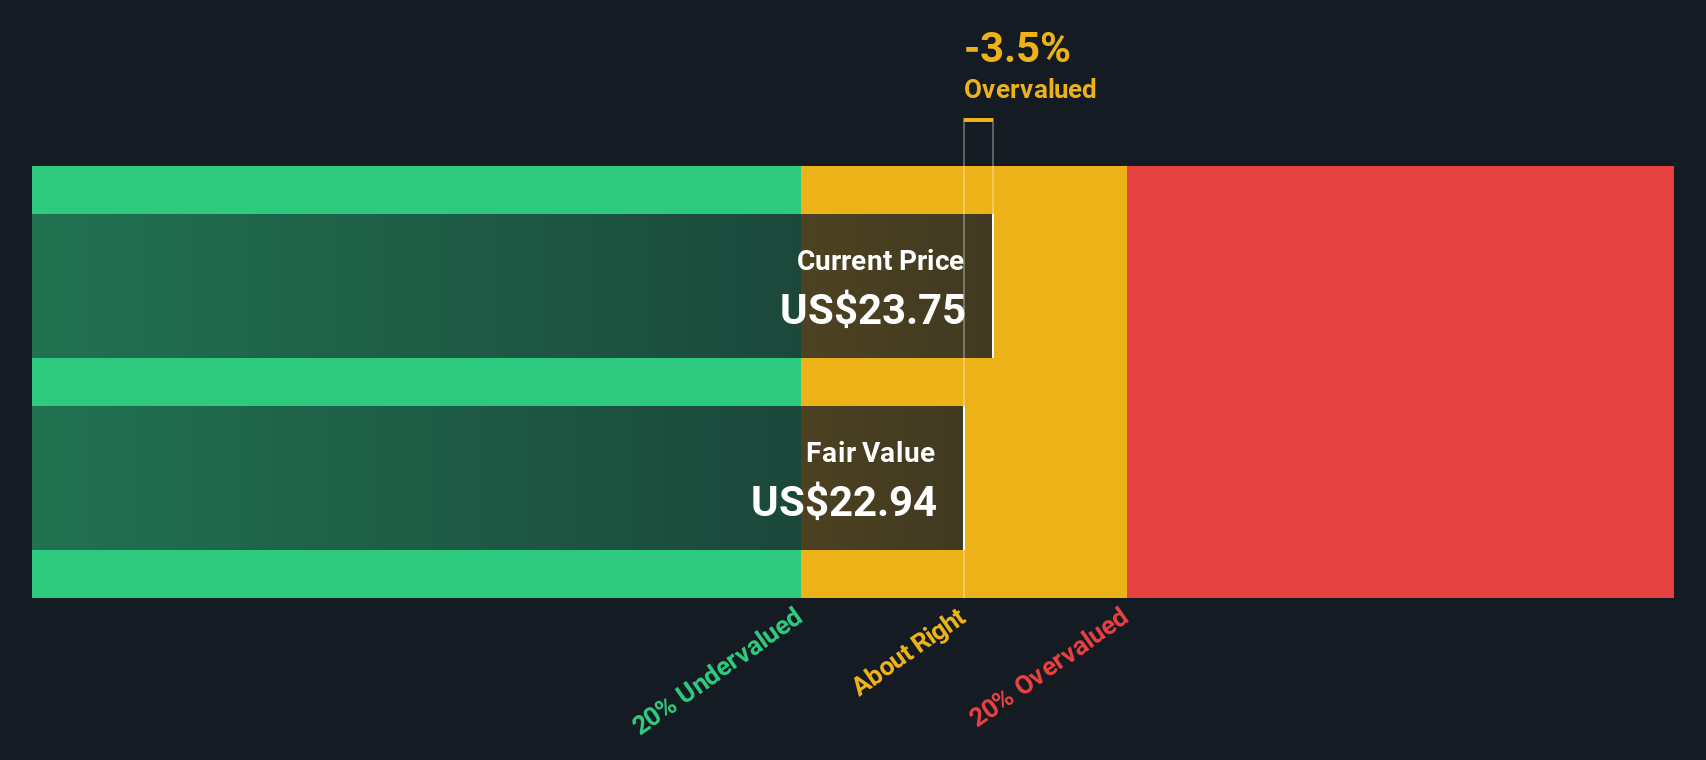
Discounting these cash flows back to today produces an estimated intrinsic value of about $24.09 per share. Compared with the current market price, this implies the stock is roughly 21.2% undervalued on a DCF basis. This indicates the market may still be pricing XPeng cautiously despite its growth outlook.
Result: UNDERVALUED
Our Discounted Cash Flow (DCF) analysis suggests XPeng is undervalued by 21.2%. Track this in your watchlist or portfolio, or discover 909 more undervalued stocks based on cash flows.
Approach 2: XPeng Price vs Sales
For companies like XPeng that are still moving toward consistent profitability, the price to sales ratio is often more useful than earnings based measures, because revenue is less volatile and less affected by near term investment spending.
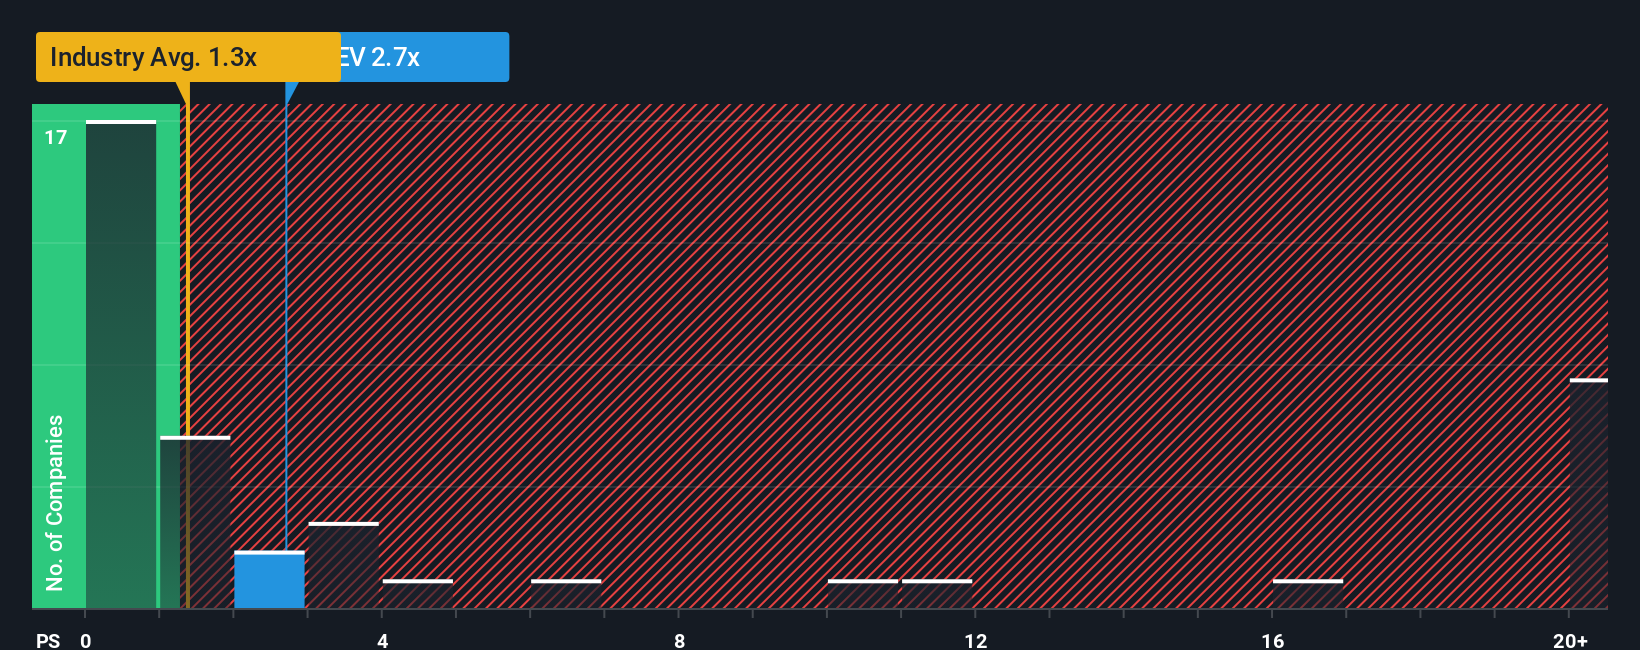
In general, faster growth and lower risk justify a higher normal multiple, while slower growth or higher uncertainty tend to cap what investors are willing to pay for each dollar of sales. XPeng currently trades on a price to sales ratio of about 1.81x, which is above the Auto industry average of roughly 0.85x and also higher than the peer group average of around 1.67x.
Simply Wall St’s Fair Ratio framework goes a step further by estimating what multiple XPeng should trade on after accounting for its growth outlook, profitability profile, industry, market cap and risk factors. On this basis, XPeng’s Fair Ratio is around 1.52x, which is somewhat below the current 1.81x. That indicates the market is paying a premium to what fundamentals alone might support, pointing to a degree of overvaluation on a sales multiple basis.
Result: OVERVALUED
PS ratios tell one story, but what if the real opportunity lies elsewhere? Discover 1446 companies where insiders are betting big on explosive growth.
Upgrade Your Decision Making: Choose your XPeng Narrative
Earlier we mentioned that there is an even better way to understand valuation, so let us introduce you to Narratives, which are simple stories you build around XPeng that connect your view of its future revenue, earnings and margins to a financial forecast and ultimately to a Fair Value estimate.
On Simply Wall St’s Community page, millions of investors use Narratives as an easy, accessible tool to express their perspective on a company in numbers, then compare that Fair Value to today’s share price to decide whether it looks like a buy, a hold or a sell.
Narratives are dynamic, so when new information comes in, such as XPeng’s latest robotaxi news, international expansion updates or recall headlines, the forecasts and Fair Values behind each story can be updated to keep your investment view current rather than static.
For example, one XPeng Narrative might lean bullish and land near the higher analyst price target around $33, assuming strong global growth and rising margins. A more cautious Narrative might sit closer to the lower target near $18, reflecting concerns about competition, execution risks and capital needs. Both can coexist on the platform so you can see where your own view fits.
Do you think there's more to the story for XPeng? Head over to our Community to see what others are saying!
This article by Simply Wall St is general in nature. We provide commentary based on historical data and analyst forecasts only using an unbiased methodology and our articles are not intended to be financial advice. It does not constitute a recommendation to buy or sell any stock, and does not take account of your objectives, or your financial situation. We aim to bring you long-term focused analysis driven by fundamental data. Note that our analysis may not factor in the latest price-sensitive company announcements or qualitative material. Simply Wall St has no position in any stocks mentioned.
Have feedback on this article? Concerned about the content? Get in touch with us directly. Alternatively, email editorial-team@simplywallst.com