
 Nasdaq
 華爾街日報
華爾街日報General American Investors (GAM) Valuation After Discounted Dividend Share Issue and Ongoing Preferred Buybacks
General American Investors Company (GAM) has set the issue price for common shares received in its 2025 year end dividend at 58.75 dollars, a discount to its 65.40 dollar net asset value, raising fresh questions about capital allocation and shareholder value.
See our latest analysis for General American Investors Company.
Despite the modest pullback in the 1 month share price return of 7.94 percent from a latest share price of 58.56 dollars, the stock's 1 year total shareholder return of 25.57 percent and 3 year total shareholder return of 110.05 percent suggest that, combined with ongoing preferred buybacks, long term momentum in the story is still very much intact.
If this kind of capital allocation story interests you, it could be a good moment to widen your search and explore fast growing stocks with high insider ownership
With the stock trading at a steep intrinsic discount but boasting triple digit three year returns, is General American Investors still a value opportunity, or are markets already pricing in the next leg of portfolio growth?
Price-to-Earnings of 7.2x: Is it justified?
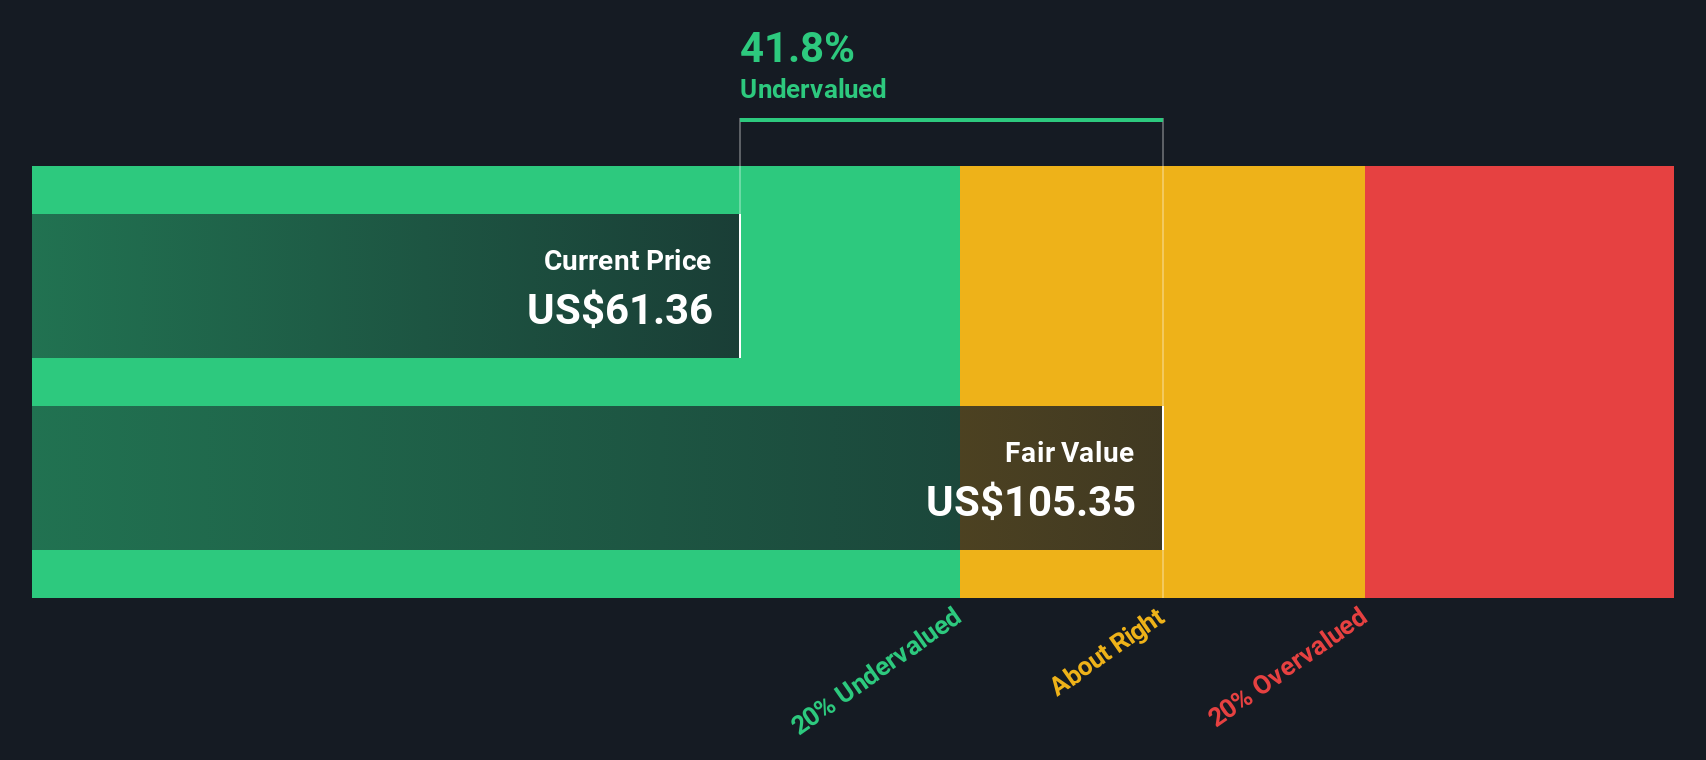
GAM looks inexpensive on earnings, with a 7.2x price-to-earnings ratio at a last close of 58.56 dollars, far below peers and industry levels.
The price-to-earnings multiple compares the company’s share price to its net earnings and is a core yardstick for valuing asset managers and capital market firms. For an investment company like General American Investors, it captures how much investors are willing to pay today for the portfolio’s current profit stream.
On this measure, GAM appears materially undervalued, trading well under our estimate of fair value of 106.83 dollars and supported by a DCF based intrinsic discount of about 45 percent. While recent profit margins have softened and last year included a sizeable one off gain, the low earnings multiple suggests the market may be heavily discounting the durability of those profits relative to its long record and seasoned management team.
Compared with a 28.5x peer average and a 25.2x US Capital Markets industry average, GAM’s 7.2x earnings multiple is starkly lower, suggesting the stock is priced as a deep value outlier rather than in line with typical sector expectations for profitability.
See what the numbers say about this price — find out in our valuation breakdown.
Result: Price-to-Earnings of 7.2x (UNDERVALUED)
However, sustained share price pressure or weaker portfolio earnings could quickly challenge the value case, especially if discounts persist without clear catalysts for narrowing.
Find out about the key risks to this General American Investors Company narrative.
Another View: SWS DCF Fair Value Check
Our DCF model broadly agrees with the earnings based view, pointing to fair value around 106.83 dollars versus the current 58.56 dollars share price, which implies that GAM still trades at roughly a 45 percent discount. Is the market being overly cautious about future portfolio returns?
Look into how the SWS DCF model arrives at its fair value.
Simply Wall St performs a discounted cash flow (DCF) on every stock in the world every day (check out General American Investors Company for example). We show the entire calculation in full. You can track the result in your watchlist or portfolio and be alerted when this changes, or use our stock screener to discover 908 undervalued stocks based on their cash flows. If you save a screener we even alert you when new companies match - so you never miss a potential opportunity.
Build Your Own General American Investors Company Narrative
If you see the numbers differently or prefer to dig into the data yourself, you can build a tailored view in just minutes. Do it your way
A great starting point for your General American Investors Company research is our analysis highlighting 1 key reward and 3 important warning signs that could impact your investment decision.
Looking for more investment ideas?
Before markets move on without you, put the Simply Wall Street Screener to work and line up your next opportunities with clear, data backed investing angles.
- Capture early stage potential by scanning these 3612 penny stocks with strong financials that already show balance sheet strength and improving fundamentals before broader attention arrives.
- Position ahead of the next technology wave by targeting these 26 AI penny stocks with real revenue traction in AI, not just hype driven headlines.
- Lock in stronger income streams by focusing on these 13 dividend stocks with yields > 3% that combine reliable payouts with sustainable financial profiles.
This article by Simply Wall St is general in nature. We provide commentary based on historical data and analyst forecasts only using an unbiased methodology and our articles are not intended to be financial advice. It does not constitute a recommendation to buy or sell any stock, and does not take account of your objectives, or your financial situation. We aim to bring you long-term focused analysis driven by fundamental data. Note that our analysis may not factor in the latest price-sensitive company announcements or qualitative material. Simply Wall St has no position in any stocks mentioned.
Have feedback on this article? Concerned about the content? Get in touch with us directly. Alternatively, email editorial-team@simplywallst.com