
 Nasdaq
 華爾街日報
華爾街日報Does Hartford Still Offer Upside After Its 215% Five Year Rally?
- If you are wondering whether Hartford Insurance Group is still a smart buy after its big run, or if most of the upside is already priced in, you are not alone. That is exactly what we are going to unpack here.
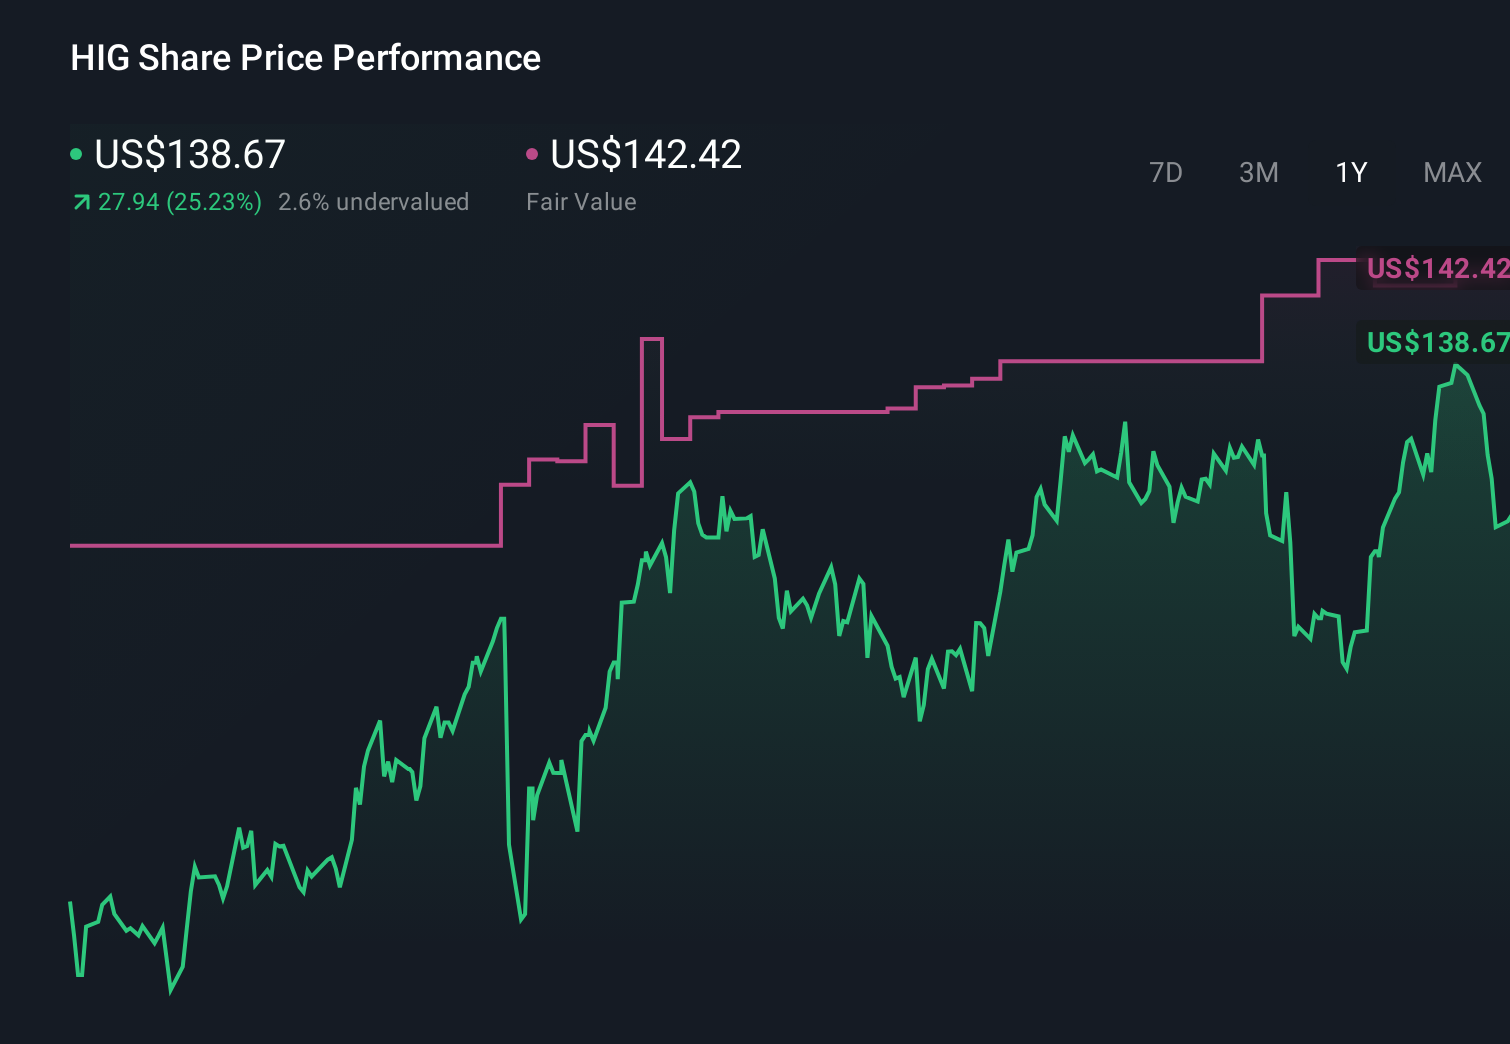
- The stock has climbed 4.5% over the last week, 24.1% year to date, and 214.9% over five years. This naturally raises the question of whether the current price around $135.3 still offers attractive value.
- Recent headlines have focused on Hartford strengthening its position in commercial lines and expanding specialty coverage, signaling that management is leaning into higher margin, stickier business. At the same time, investors have been paying attention to the broader insurance sector's resilience in a higher rate environment, which helps explain some of the momentum in the share price.
- On our checklist style valuation framework, Hartford scores 5/6 for being undervalued. This is a strong result and worth examining more closely as we compare different valuation methods. Later on we will look at an additional way to make sense of what that score may mean for long term investors.
Approach 1: Hartford Insurance Group Excess Returns Analysis
The Excess Returns model looks at how much value Hartford Insurance Group creates above the basic return that shareholders demand on their equity. Instead of just comparing earnings multiples, it asks whether the company is consistently earning more on its equity base than its cost of equity.
Hartford currently has a Book Value of $64.78 per share and a Stable Book Value estimate of $73.46 per share, based on weighted future book value estimates from 10 analysts. Its Stable EPS is estimated at $13.36 per share, derived from future return on equity forecasts from 7 analysts. With an Average Return on Equity of 18.19% versus a Cost of Equity of $5.11 per share, the model calculates an Excess Return of $8.25 per share. This indicates that Hartford is generating value over its funding cost according to the model’s inputs.
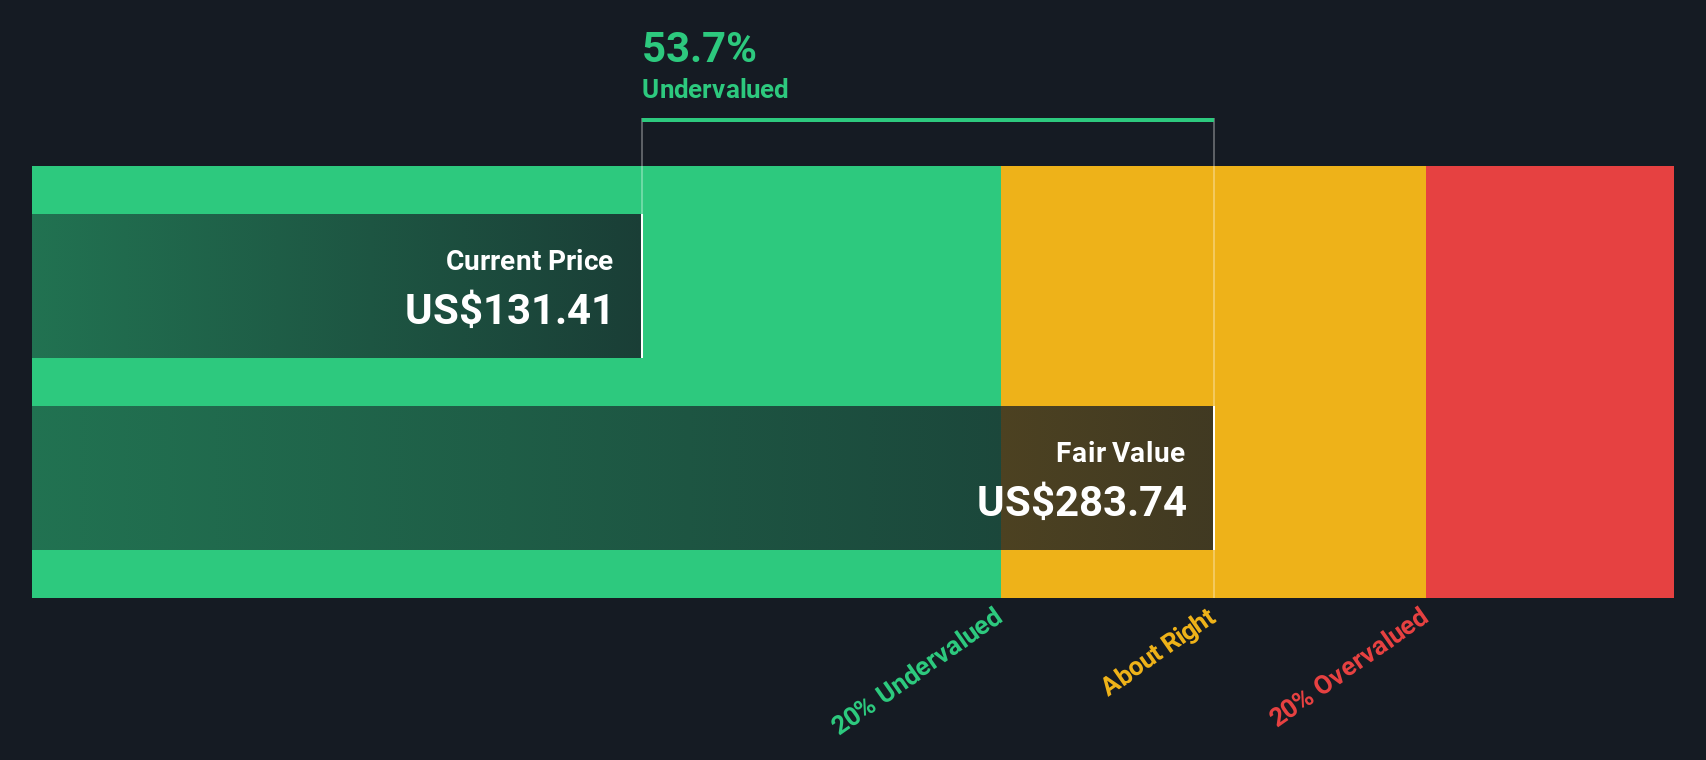
Using these inputs, the Excess Returns valuation produces an intrinsic value of about $296.76 per share, which is roughly 54.4% above the current price near $135.30. On this basis, the stock appears significantly undervalued relative to the model’s estimate and is presented as offering a wide margin of safety.
Result: UNDERVALUED
Our Excess Returns analysis suggests Hartford Insurance Group is undervalued by 54.4%. Track this in your watchlist or portfolio, or discover 908 more undervalued stocks based on cash flows.
Approach 2: Hartford Insurance Group Price vs Earnings
For a consistently profitable business like Hartford Insurance Group, the price to earnings (PE) ratio is a useful way to gauge how much investors are willing to pay for each dollar of current earnings. It links the share price directly to the company’s underlying profitability, which tends to be more stable and informative than short term revenue moves.
What counts as a normal or fair PE depends on how fast earnings are expected to grow and how risky those earnings are. Higher growth and lower risk usually justify a higher PE, while slower growth or more uncertainty call for a lower one. Hartford currently trades on a PE of about 10.66x, slightly below both the Insurance industry average of around 13.46x and the peer group average of roughly 10.96x.
Simply Wall St’s Fair Ratio framework goes a step further by estimating what PE Hartford should trade on, given its growth outlook, profitability, risk profile, industry and market cap. For Hartford, the Fair Ratio is 13.01x, meaning the shares look undervalued relative to that tailored benchmark rather than just simple peer or industry comparisons.
Result: UNDERVALUED

PE ratios tell one story, but what if the real opportunity lies elsewhere? Discover 1445 companies where insiders are betting big on explosive growth.
Upgrade Your Decision Making: Choose your Hartford Insurance Group Narrative
Earlier we mentioned that there is an even better way to understand valuation, so let us introduce you to Narratives, an easy tool on Simply Wall St’s Community page that lets you turn your view of Hartford Insurance Group into a simple story backed by a full financial forecast and a clear Fair Value you can compare with today’s price to decide whether to buy, hold or sell. It automatically updates as new news or earnings arrive. One investor might build a bullish Hartford Narrative around digital and E and S growth, steady 5.3% revenue gains, stable 11.6% margins and a Fair Value near the top analyst target of about $163. A more cautious investor could stress catastrophe risks, margin pressure and softer pricing to arrive closer to the $120 bear case. Both Narratives transparently link their assumptions to future revenue, earnings, margins and a fair PE multiple so you can see exactly how a story about the business translates into numbers and, ultimately, a valuation you can act on.
Do you think there's more to the story for Hartford Insurance Group? Head over to our Community to see what others are saying!
This article by Simply Wall St is general in nature. We provide commentary based on historical data and analyst forecasts only using an unbiased methodology and our articles are not intended to be financial advice. It does not constitute a recommendation to buy or sell any stock, and does not take account of your objectives, or your financial situation. We aim to bring you long-term focused analysis driven by fundamental data. Note that our analysis may not factor in the latest price-sensitive company announcements or qualitative material. Simply Wall St has no position in any stocks mentioned.
Have feedback on this article? Concerned about the content? Get in touch with us directly. Alternatively, email editorial-team@simplywallst.com