
 Nasdaq
 華爾街日報
華爾街日報Is It Too Late To Consider Principal Financial Group After Its Strong Multi Year Rally?
- Wondering if Principal Financial Group is still good value after its long run up, or if most of the upside is already priced in? Here is a breakdown of what the market might be getting right or missing about this insurer and asset manager.
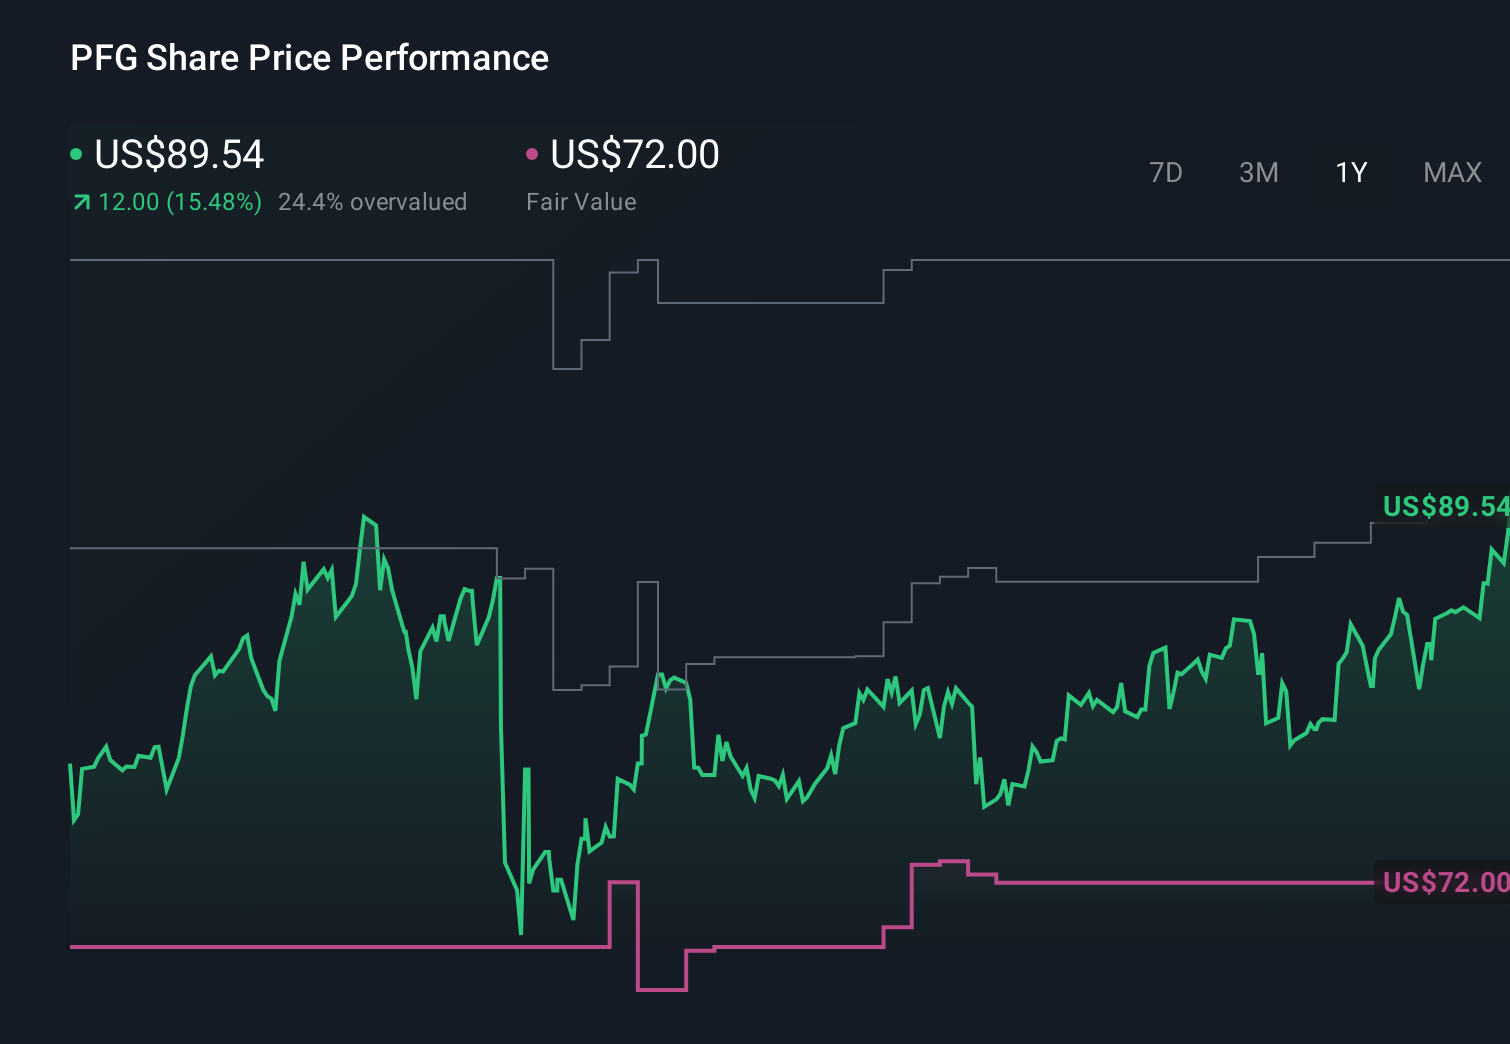
- The stock has quietly pushed higher, gaining 2.8% over the last week, 6.5% over the past month, and 16.2% year to date, while delivering 18.4% over 1 year and 124.7% over 5 years.
- Those gains have come as investors have generally rewarded financials with strong capital positions and consistent capital return programs, and Principal has stayed in that conversation alongside other diversified insurers. At the same time, shifting expectations around interest rates and demand for retirement solutions have kept sentiment around names like PFG more active than usual.
- Even after this performance, Principal scores a 4/6 valuation check score. This suggests there may still be pockets of undervaluation that classic metrics do not fully capture. The methods behind that score are outlined next, followed by a more nuanced way to think about what the stock is really worth.
Approach 1: Principal Financial Group Excess Returns Analysis
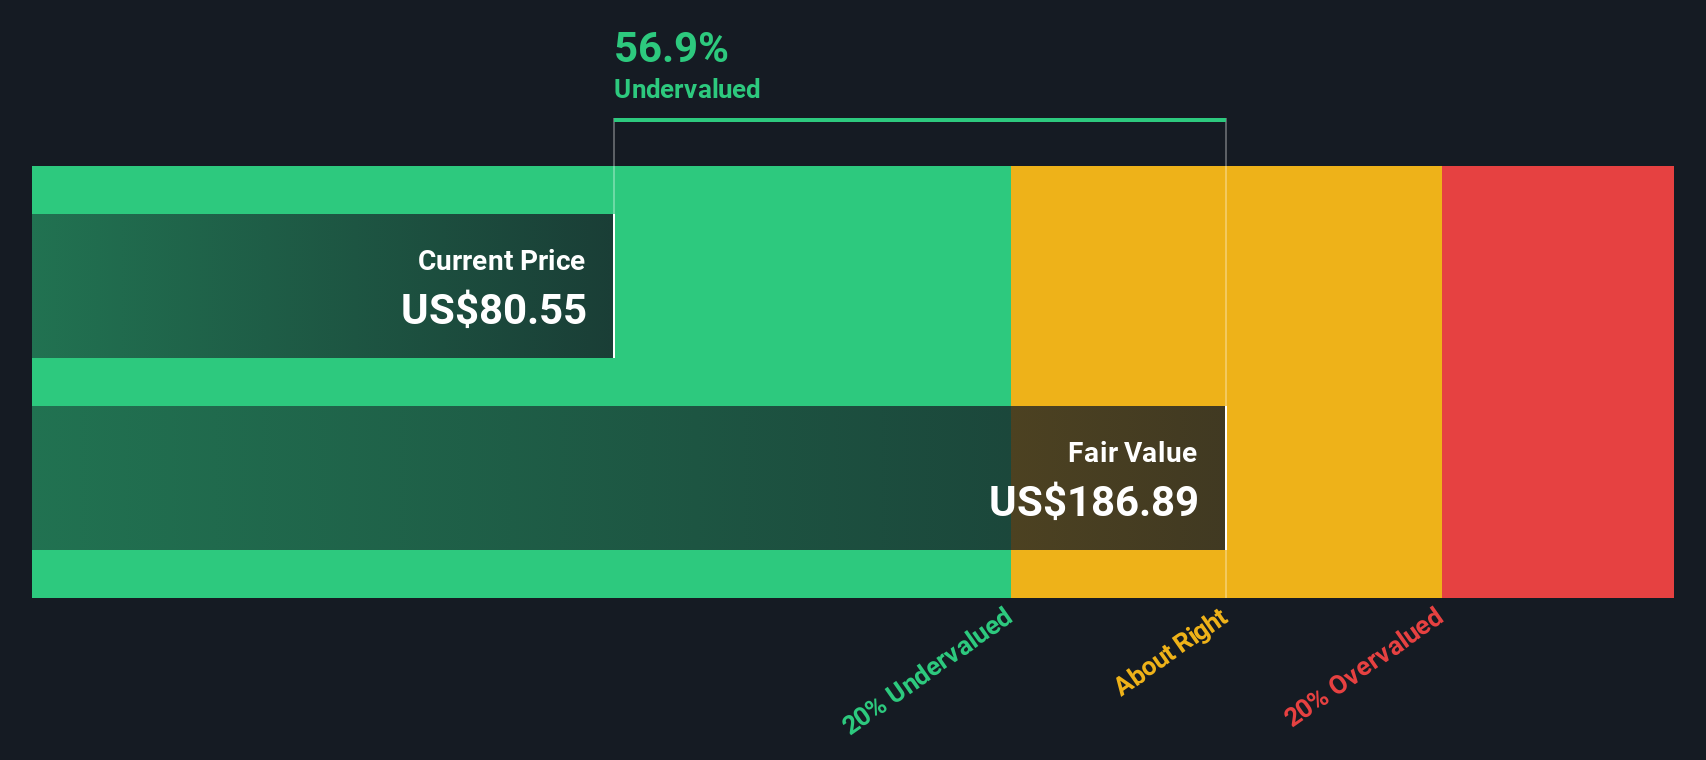
The Excess Returns model looks at how much profit Principal Financial Group can generate above its cost of equity, then capitalizes those surplus profits into an intrinsic value per share.
In this framework, Principal starts with a Book Value of $52.90 per share and a Stable EPS of $9.21 per share, based on weighted future return on equity estimates from 7 analysts. With an Average Return on Equity of 15.80% and a Cost of Equity of $4.05 per share, the company is expected to earn an Excess Return of $5.16 per share. That excess is applied to a projected Stable Book Value of $58.29 per share, again grounded in analyst forecasts, to estimate the long run economic value the franchise can sustain.
Putting these components together, the Excess Returns model indicates an intrinsic value around $197.83 per share, implying the stock is roughly 54.5% undervalued versus the current market price. In this view, the market is still discounting Principal as if its strong returns on equity are not durable.
Result: UNDERVALUED
Our Excess Returns analysis suggests Principal Financial Group is undervalued by 54.5%. Track this in your watchlist or portfolio, or discover 908 more undervalued stocks based on cash flows.
Approach 2: Principal Financial Group Price vs Earnings
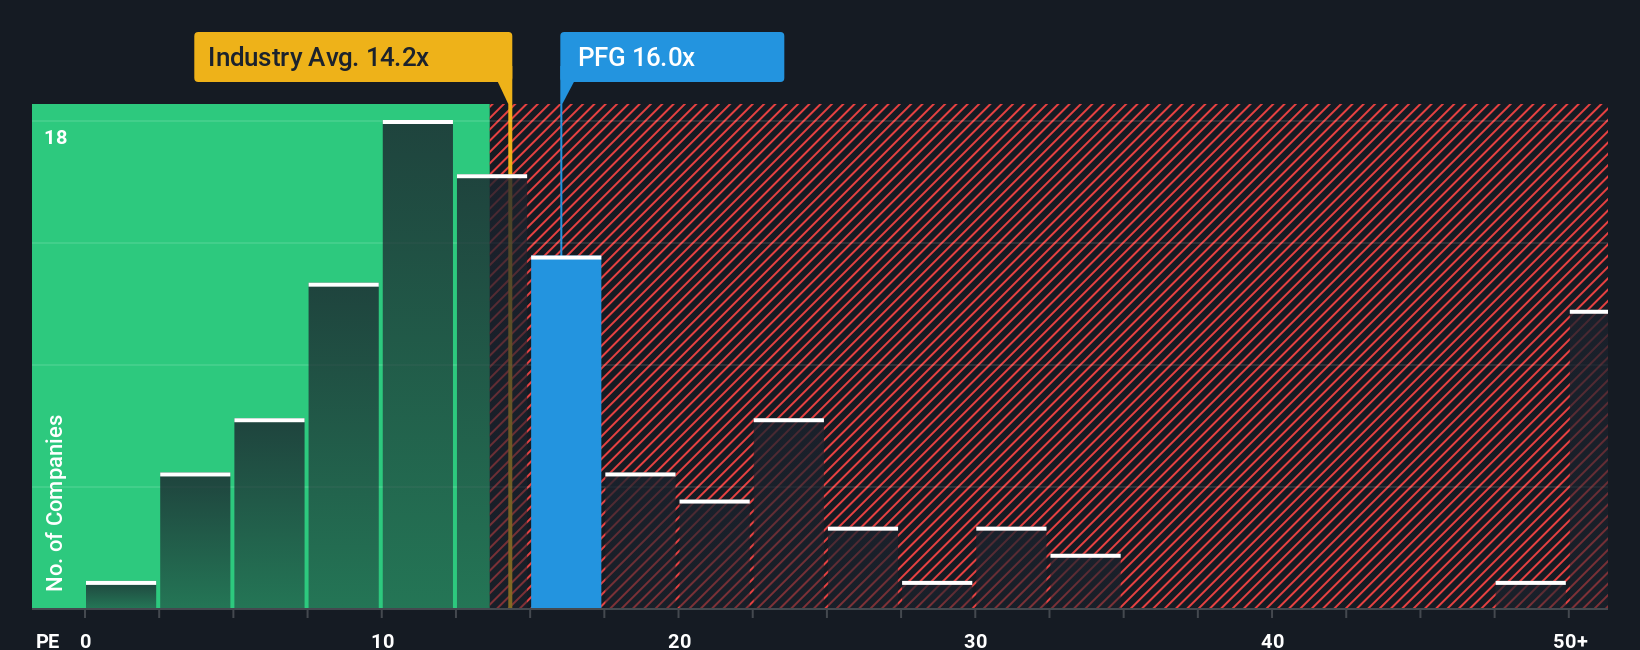
For a consistently profitable business like Principal Financial Group, the price to earnings, or PE, ratio is a practical way to gauge how much investors are willing to pay for each dollar of current earnings. Over time, that multiple tends to reflect what the market thinks about a company’s growth runway and the risks around its profits, with faster growing or more resilient businesses usually supporting higher PE ratios.
In Principal’s case, the stock currently trades on a PE of around 12.56x. That sits below both the broader Insurance industry average of about 13.46x and the peer group average of roughly 10.97x, suggesting the market is pricing Principal at a modest premium to close peers but still at a discount to the wider sector.
Simply Wall St’s Fair Ratio framework goes a step further by estimating what PE multiple Principal should trade on, after accounting for its earnings growth outlook, profitability, risk profile, industry, and size. On that basis, Principal’s Fair Ratio is 17.02x, noticeably higher than its current 12.56x. This indicates the market is not fully recognizing the company’s earnings power and risk adjusted profile.
Result: UNDERVALUED
PE ratios tell one story, but what if the real opportunity lies elsewhere? Discover 1445 companies where insiders are betting big on explosive growth.
Upgrade Your Decision Making: Choose your Principal Financial Group Narrative
Earlier we mentioned that there is an even better way to understand valuation, so let us introduce you to Narratives, a simple way to connect your view of Principal Financial Group’s future to a concrete forecast and Fair Value estimate that you can easily compare to today’s share price.
A Narrative is your story behind the numbers, where you combine assumptions about future revenue, earnings, and margins with your perspective on the business. The Simply Wall St platform then turns that story into a financial forecast and Fair Value, right inside the Community page used by millions of investors.
Because Narratives are updated automatically as fresh news or earnings are released, they give you a dynamic tool for supporting your decision making by showing whether your Fair Value still sits above or below the current market price.
For Principal Financial Group, for example, one investor might build a bullish Narrative around global retirement growth and strong capital returns that supports a Fair Value near the high analyst target of $101. A more cautious investor might emphasize competitive and flow risks and land closer to the low target of $72, and Narratives make both perspectives explicit and easy to track over time.
Do you think there's more to the story for Principal Financial Group? Head over to our Community to see what others are saying!
This article by Simply Wall St is general in nature. We provide commentary based on historical data and analyst forecasts only using an unbiased methodology and our articles are not intended to be financial advice. It does not constitute a recommendation to buy or sell any stock, and does not take account of your objectives, or your financial situation. We aim to bring you long-term focused analysis driven by fundamental data. Note that our analysis may not factor in the latest price-sensitive company announcements or qualitative material. Simply Wall St has no position in any stocks mentioned.
Have feedback on this article? Concerned about the content? Get in touch with us directly. Alternatively, email editorial-team@simplywallst.com