
 Nasdaq
 華爾街日報
華爾街日報Is Wix a Long Term Opportunity After a 53% Slide and DCF Upside?
- Wondering whether Wix.com at around $101.87 is a beaten down opportunity or a value trap? This article is going to walk through the numbers in plain English so you can judge for yourself.
- The stock has been choppy, up 1.6% over the last week but down 18.7% over the last month. It is still sitting on steep drops of 53.0% year to date and 53.6% over the last year, despite being up 25.9% over three years.
- Recent share price moves have come alongside ongoing headlines about Wix sharpening its focus on higher value users and expanding into more complete business solutions, from websites and eCommerce to bookings and payments. At the same time, competition in website building and online presence tools remains fierce, which is keeping investors on edge and adding volatility.
- On our numbers, Wix.com scores a 4/6 valuation check score, suggesting it looks undervalued on several, but not all, metrics. Next we will break down what those different valuation approaches are hinting at, before circling back at the end to an even better way of thinking about what Wix is really worth.
Find out why Wix.com's -53.6% return over the last year is lagging behind its peers.
Approach 1: Wix.com Discounted Cash Flow (DCF) Analysis
A Discounted Cash Flow, or DCF, model estimates what a business is worth by projecting the cash it can generate in the future and then discounting those cash flows back to today in dollar terms.
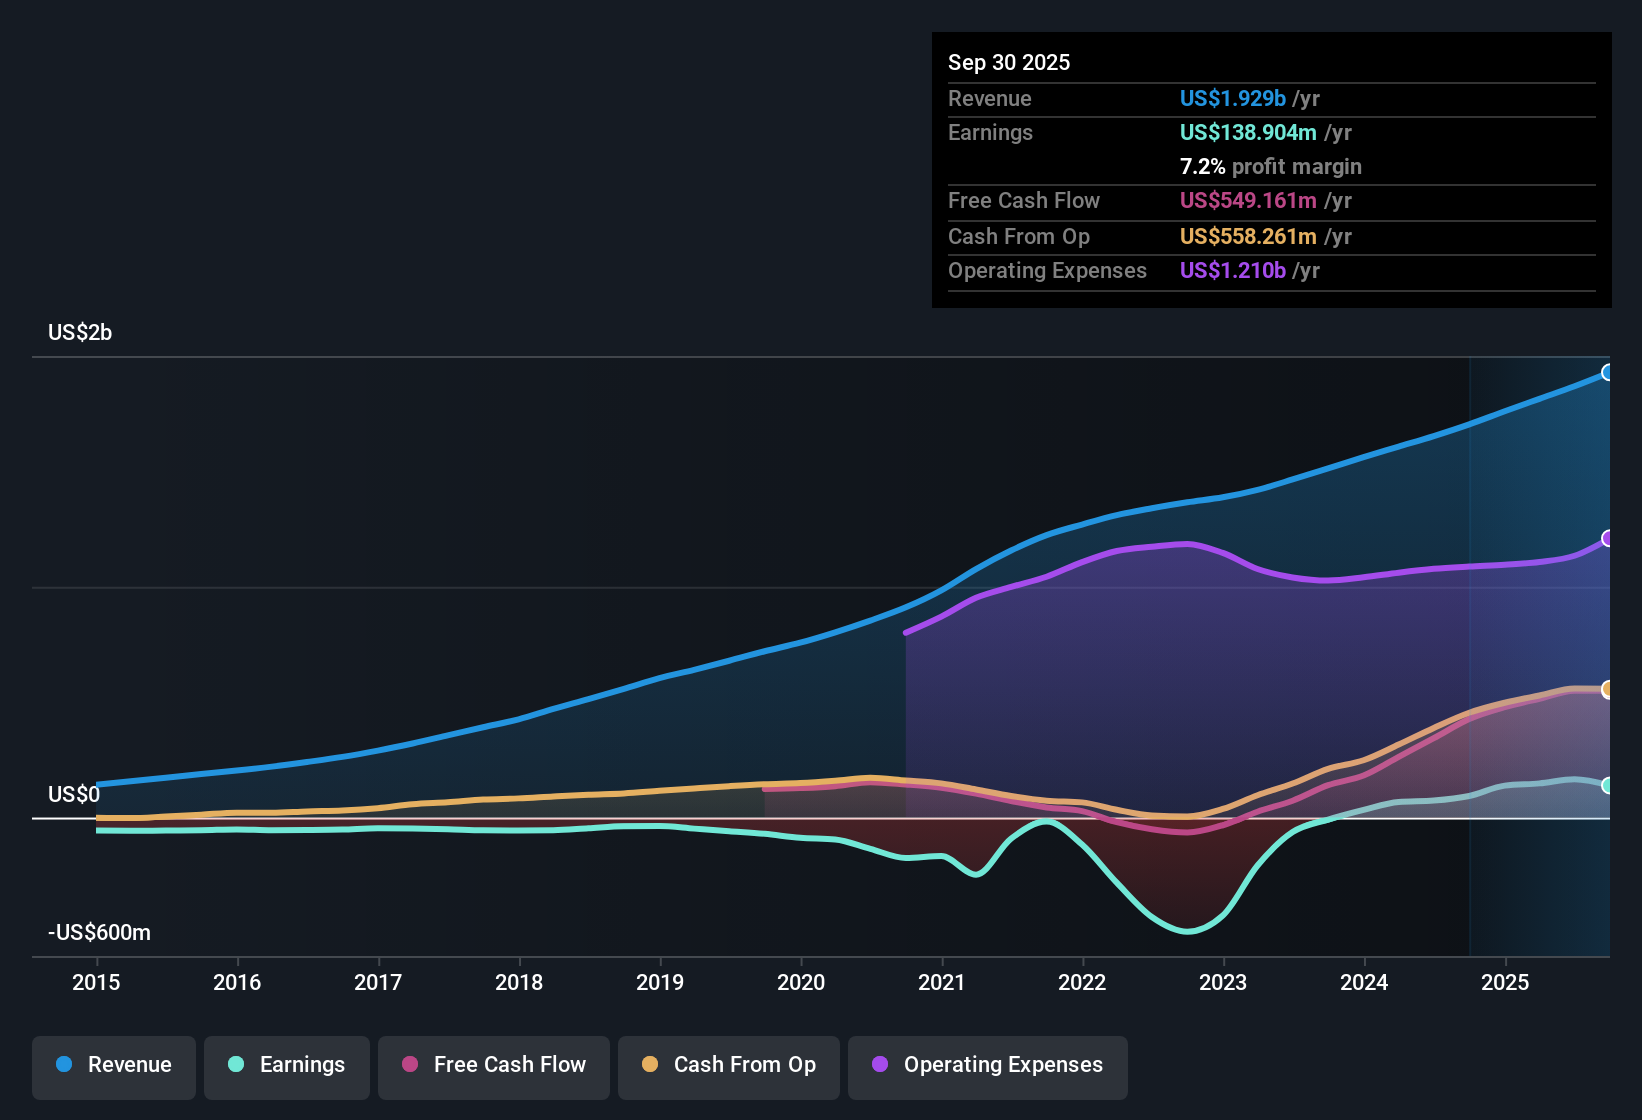
For Wix.com, the latest twelve month free cash flow sits at about $518 million. Analysts and model assumptions expect this to grow steadily, with projected free cash flow reaching roughly $1.15 billion by 2035. Only the next few years are based on analyst forecasts, while the later years are extrapolated by Simply Wall St using a 2 Stage Free Cash Flow to Equity approach that tapers growth as the business matures.
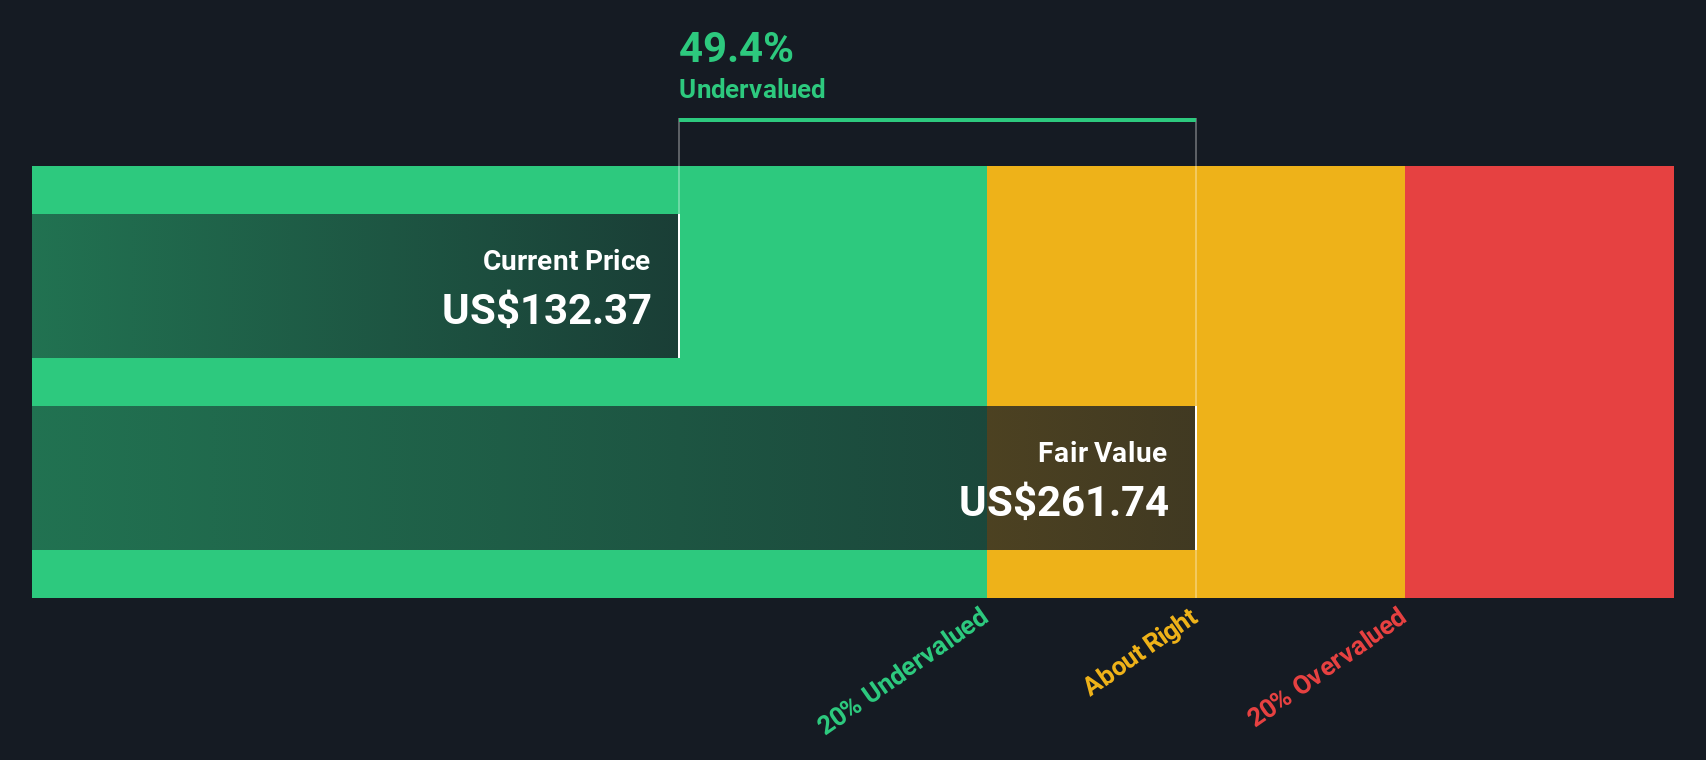
On this basis, the DCF model arrives at an intrinsic value of about $154.96 per share. Compared with the current share price around $101.87, the model implies the stock is roughly 34.3% undervalued, which indicates the market may be underestimating Wix’s future cash generation.
Result: UNDERVALUED
Our Discounted Cash Flow (DCF) analysis suggests Wix.com is undervalued by 34.3%. Track this in your watchlist or portfolio, or discover 908 more undervalued stocks based on cash flows.
Approach 2: Wix.com Price vs Earnings
For a profitable business like Wix.com, the price to earnings, or PE, ratio is a straightforward way to gauge how much investors are paying for each dollar of current profit. In general, faster growing and lower risk companies can justify a higher PE, while slower growth or higher uncertainty should translate into a lower, more cautious multiple.
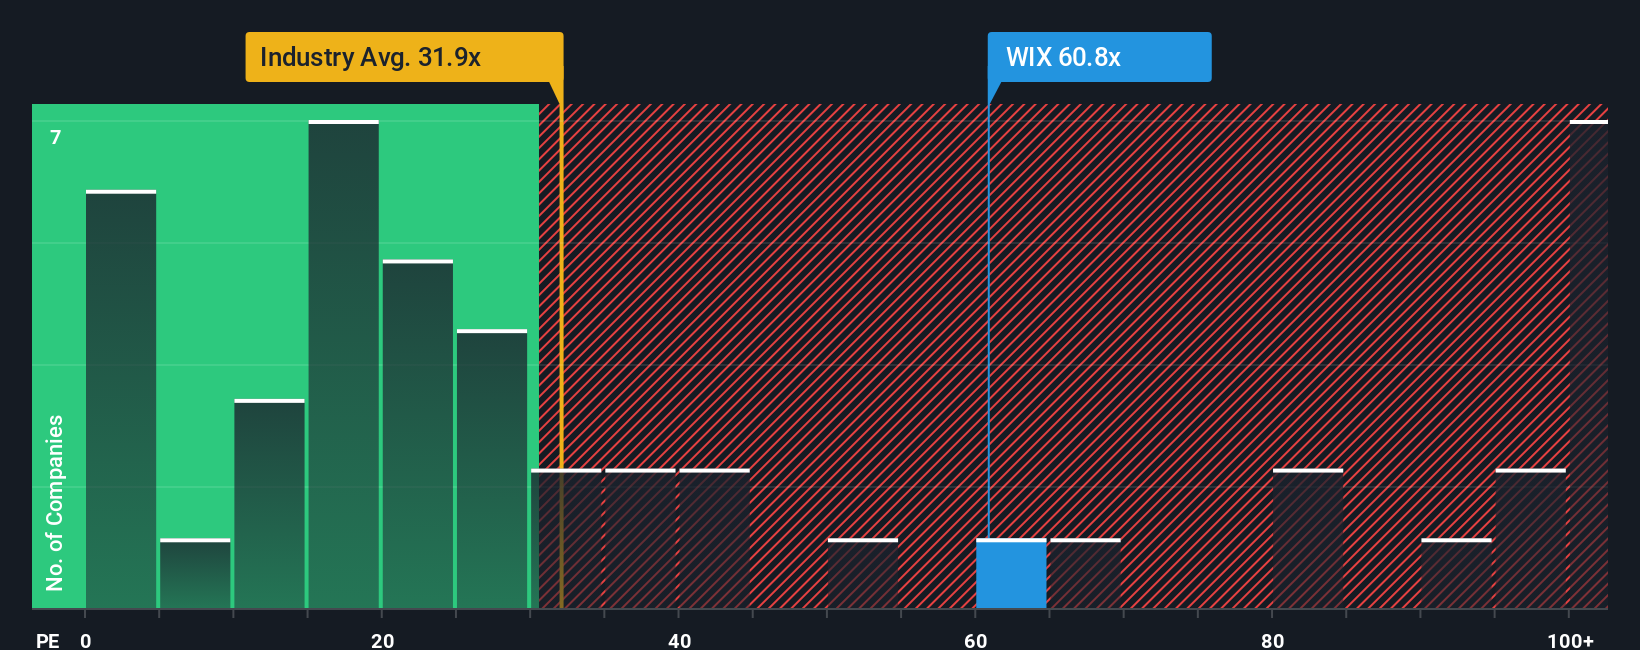
Wix currently trades on a PE of about 40.1x. That is slightly below the average of its direct peers at around 41.9x, but meaningfully above the broader IT industry average of roughly 29.9x, which suggests the market is already pricing in stronger growth and quality than the typical sector player.
Simply Wall St’s Fair Ratio for Wix, at 37.1x, is an estimate of what its PE “should” be once you factor in its specific earnings growth profile, profit margins, industry, market cap and stock specific risks. This makes it more tailored than a simple peer or industry comparison, which can overlook important differences in business quality and outlook. With the current 40.1x PE sitting modestly above the 37.1x Fair Ratio, the shares look slightly expensive on this lens.
Result: OVERVALUED
PE ratios tell one story, but what if the real opportunity lies elsewhere? Discover 1445 companies where insiders are betting big on explosive growth.
Upgrade Your Decision Making: Choose your Wix.com Narrative
Earlier we mentioned that there is an even better way to understand valuation, so let us introduce you to Narratives, which are simple, investor created stories that connect your view of Wix.com’s business drivers to a concrete forecast for its future revenue, earnings and margins, and then translate that into a personal Fair Value you can compare to today’s share price to decide whether to buy, hold or sell.
On Simply Wall St’s Community page, millions of investors can quickly build or browse Narratives that tie together what they believe about Wix, such as how fast AI powered tools and Base44 will grow, what profit margins might look like once current investments mature, or how competitive risks could constrain pricing power, and see how those assumptions feed into a dynamic valuation that automatically updates as new news, earnings or guidance is released.
For example, one Wix Narrative might assume robust AI driven adoption and improving margins, and assign a Fair Value closer to $255 per share. A more cautious Narrative could focus on rising competition, cost pressures and execution risks to arrive nearer $160. This illustrates how different yet reasonable perspectives can coexist and can help you understand which story, and therefore which valuation, you actually agree with.
Do you think there's more to the story for Wix.com? Head over to our Community to see what others are saying!
This article by Simply Wall St is general in nature. We provide commentary based on historical data and analyst forecasts only using an unbiased methodology and our articles are not intended to be financial advice. It does not constitute a recommendation to buy or sell any stock, and does not take account of your objectives, or your financial situation. We aim to bring you long-term focused analysis driven by fundamental data. Note that our analysis may not factor in the latest price-sensitive company announcements or qualitative material. Simply Wall St has no position in any stocks mentioned.
Have feedback on this article? Concerned about the content? Get in touch with us directly. Alternatively, email editorial-team@simplywallst.com