
 Nasdaq
 華爾街日報
華爾街日報Does Artivion’s 2025 Surge Still Make Sense After Recent Medtech Rally?
- If you're wondering whether Artivion still looks attractive after its big run up, or if most of the upside has already been priced in, this breakdown will help you see what the numbers are really saying about its valuation.
- The stock has been on a strong multi year climb, up 254.2% over 3 years and 105.8% over 5 years, with a 60.7% gain year to date and 56.0% over the last year. Even so, the last 30 days have seen a modest 1.3% pullback after a 1.2% rise this past week.
- Recent market interest has been linked to Artivion's positioning in cardiac and vascular surgery technologies, where demand for innovative solutions has been steadily rising and drawing more investor attention to specialized medtech names. In addition, sector wide optimism around companies that supply life saving devices has helped lift sentiment, which supports the idea that investors may be willing to pay higher prices for perceived long term growth stories in this niche.
- Despite that enthusiasm, Artivion only scores 0/6 on our valuation checks, which means it does not screen as undervalued on any of the metrics we use. Next, we will walk through the different valuation approaches behind that score and then finish with a more practical way to think about what the stock might be worth.
Artivion scores just 0/6 on our valuation checks. See what other red flags we found in the full valuation breakdown.
Approach 1: Artivion Discounted Cash Flow (DCF) Analysis
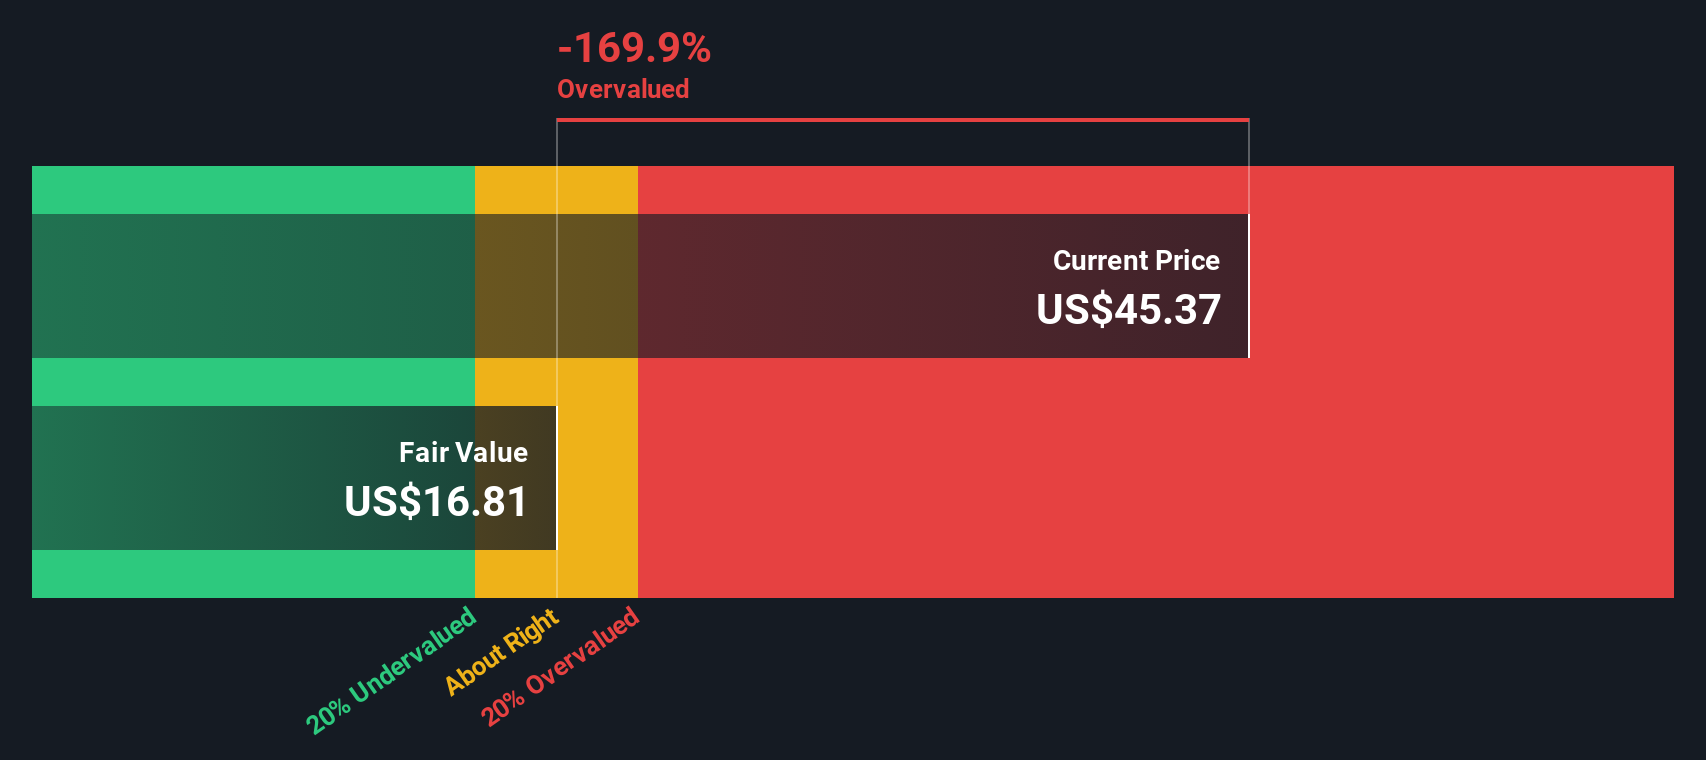
A Discounted Cash Flow model estimates what a company is worth by projecting its future cash flows and then discounting those cash flows back into today’s dollars. For Artivion, this analysis starts with last twelve month free cash flow of about $9.6 million and then applies analyst forecasts for the next few years, with further years extrapolated by Simply Wall St.
Under this 2 Stage Free Cash Flow to Equity model, Artivion’s free cash flow is projected to rise steadily, reaching around $54.8 million by 2035. Each of those yearly cash flows is discounted back into today’s value using a required rate of return, and then summed to arrive at an estimated intrinsic value per share of roughly $16.81.
When that intrinsic value is compared with the current market price, the DCF suggests the shares are about 168.4% above the level supported by these cash flow projections. On this basis, the stock appears significantly overvalued.
Result: OVERVALUED
Our Discounted Cash Flow (DCF) analysis suggests Artivion may be overvalued by 168.4%. Discover 908 undervalued stocks or create your own screener to find better value opportunities.
Approach 2: Artivion Price vs Sales
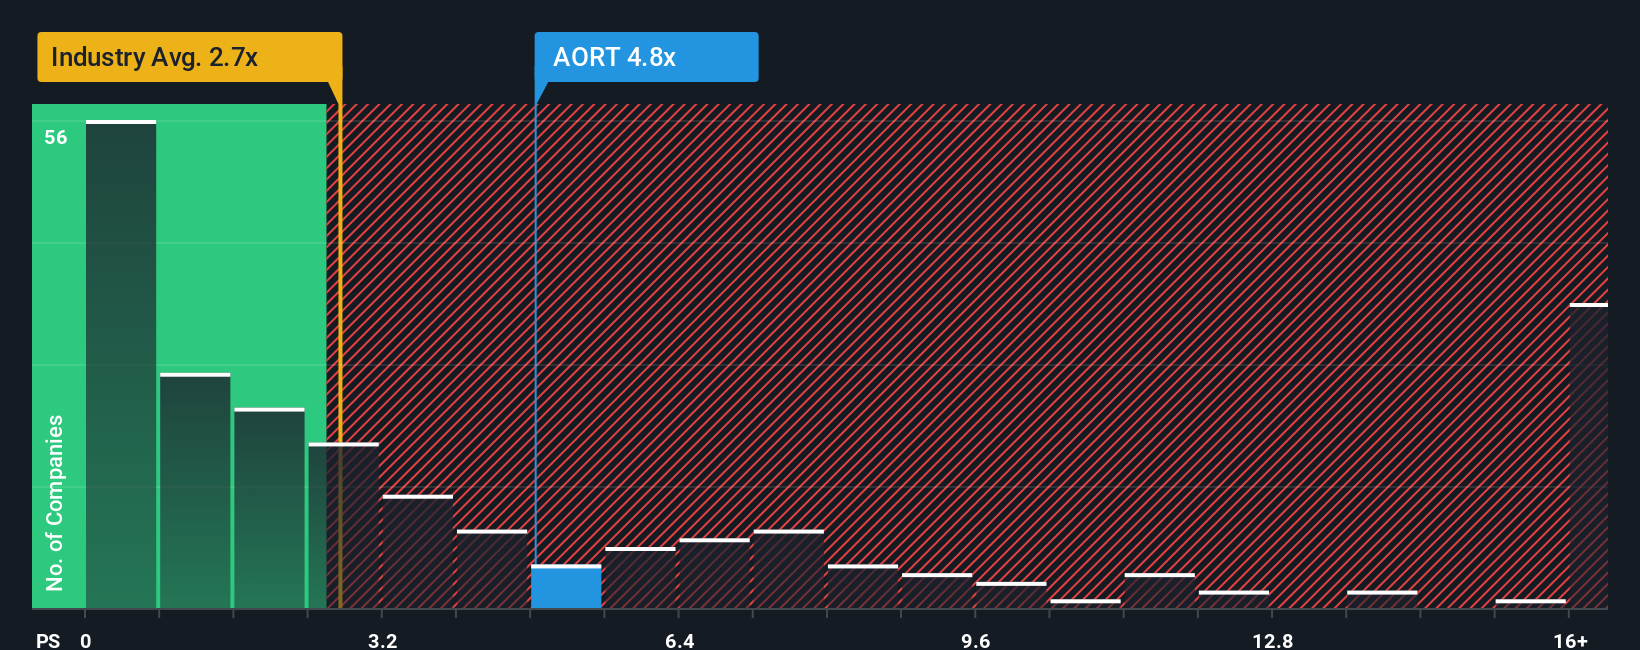
For companies like Artivion that are still building consistent profitability, the price to sales (P/S) ratio is often a more useful yardstick than earnings based metrics. It focuses on how much investors are paying for each dollar of revenue, which tends to be more stable than earnings for fast evolving medical technology businesses.
In general, higher growth and lower risk justify a higher “normal” or “fair” sales multiple, while slower or more volatile businesses tend to deserve a lower one. Artivion currently trades on a P/S of about 5.1x, compared with the broader Medical Equipment industry average of roughly 3.5x and a peer group average of around 3.5x, suggesting the market is already placing a premium on the stock.
Simply Wall St’s Fair Ratio for Artivion, at about 2.7x, estimates the P/S you might expect given its growth outlook, profitability profile, industry, market cap and specific risks. This is more tailored than a simple comparison with peers or industry averages because it incorporates company specific strengths and weaknesses rather than assuming all medtech names deserve the same multiple. Since Artivion’s actual 5.1x P/S sits well above this 2.7x Fair Ratio, the stock appears richly valued on a sales basis.
Result: OVERVALUED
PS ratios tell one story, but what if the real opportunity lies elsewhere? Discover 1445 companies where insiders are betting big on explosive growth.
Upgrade Your Decision Making: Choose your Artivion Narrative
Earlier we mentioned that there is an even better way to understand valuation, so let us introduce you to Narratives. This is a simple framework on Simply Wall St’s Community page that lets you connect your view of Artivion’s story to a set of assumptions about future revenue, earnings and margins. It then turns that story into a financial forecast and then into a Fair Value you can compare against today’s share price to decide whether to buy, hold or sell. The platform automatically updates your Narrative as new news or earnings arrive. For example, a highly optimistic Artivion Narrative might assume strong clinical adoption, rising margins and a Fair Value closer to about $50 per share. A more cautious Narrative might lean on slower growth, tighter margins and a Fair Value nearer $39. This clearly shows how different perspectives on the same business can lead to very different, but transparent, valuation outcomes.
Do you think there's more to the story for Artivion? Head over to our Community to see what others are saying!

This article by Simply Wall St is general in nature. We provide commentary based on historical data and analyst forecasts only using an unbiased methodology and our articles are not intended to be financial advice. It does not constitute a recommendation to buy or sell any stock, and does not take account of your objectives, or your financial situation. We aim to bring you long-term focused analysis driven by fundamental data. Note that our analysis may not factor in the latest price-sensitive company announcements or qualitative material. Simply Wall St has no position in any stocks mentioned.
Have feedback on this article? Concerned about the content? Get in touch with us directly. Alternatively, email editorial-team@simplywallst.com