
 Nasdaq
 華爾街日報
華爾街日報Has Klarna’s Falling 2025 Share Price Created a Mispriced Opportunity?
- If you are wondering whether Klarna Group is a bargain or a value trap at current levels, this article will walk through what the numbers are really saying about the stock.
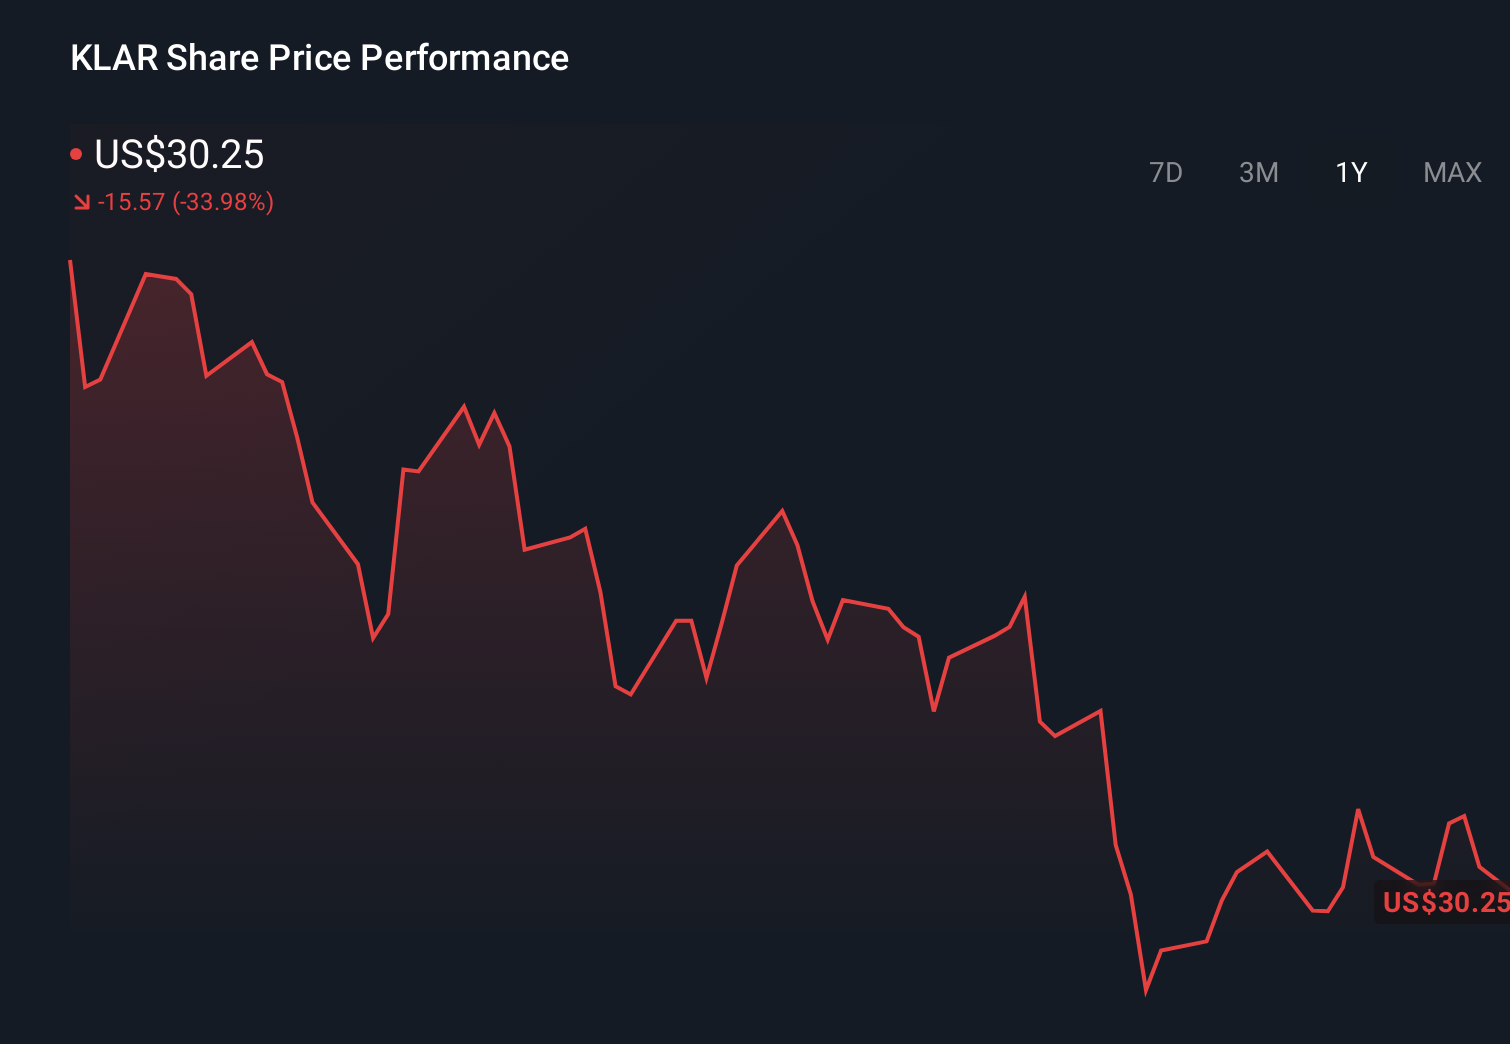
- Despite all the buzz around fintech, Klarna's share price has drifted lower recently, slipping about 0.8% over the last week and roughly 9.3% over the past month, and is now down around 32.1% year to date.
- Recent headlines have focused on Klarna's continued push into new markets and partnerships, alongside ongoing debate about the durability of the buy now, pay later model in a higher rate environment. Taken together, these stories help explain why the market has been rethinking both Klarna's growth runway and its risk profile.
- On our framework, Klarna currently scores 2 out of 6 on valuation checks. This suggests it only looks undervalued on a couple of metrics. Next we will unpack those methods in detail and then finish with a more intuitive way to think about what the stock is truly worth.
Klarna Group scores just 2/6 on our valuation checks. See what other red flags we found in the full valuation breakdown.
Approach 1: Klarna Group Excess Returns Analysis
The Excess Returns model looks at how much profit a company can generate above the return that investors require for the risk they are taking. In other words, it asks whether Klarna is creating enough value on its equity base to justify today’s price.
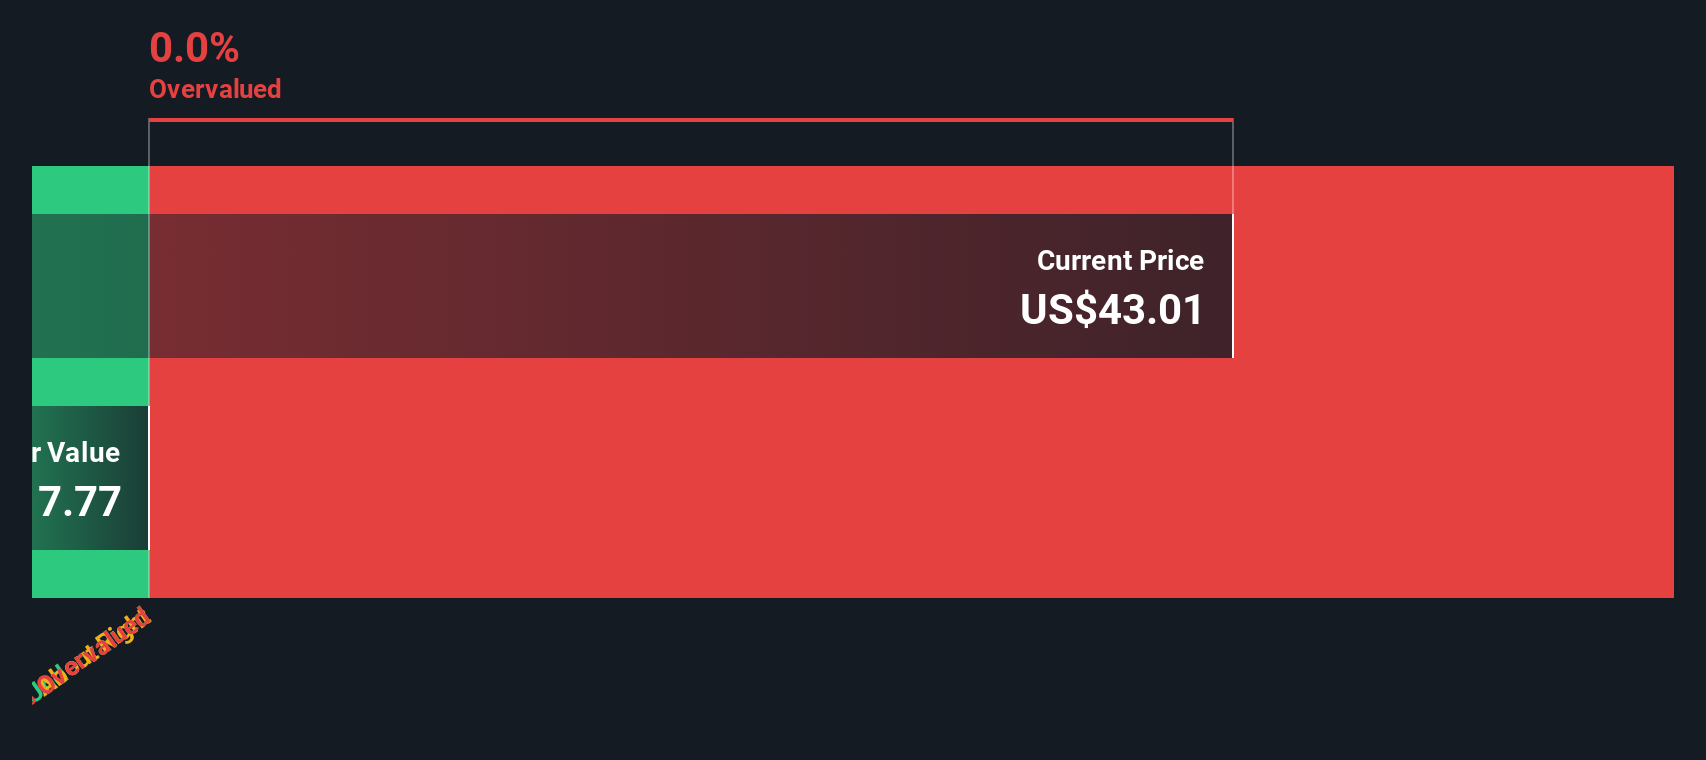
For Klarna Group, the key inputs are not especially flattering. Book Value stands at about $6.49 per share, while Stable EPS is estimated at roughly $0.35 per share, based on weighted future Return on Equity forecasts from 8 analysts. Against a Cost of Equity of about $0.67 per share, this translates into an Excess Return of roughly $-0.32 per share, which suggests Klarna is not currently expected to earn more than its cost of capital. The Average Return on Equity is 4.35%, and Stable Book Value is projected to rise to about $8.09 per share, based on estimates from 5 analysts.
Using these figures in the Excess Returns framework produces an intrinsic value that appears far below the current share price. On this basis, Klarna is calculated to be roughly 1662.7% overvalued.
Result: OVERVALUED
Our Excess Returns analysis suggests Klarna Group may be overvalued by 1662.7%. Discover 908 undervalued stocks or create your own screener to find better value opportunities.
Approach 2: Klarna Group Price vs Sales
For a business like Klarna that is still reshaping its profitability profile, the price to sales multiple is a practical way to anchor valuation, because it focuses on how the market values each dollar of revenue rather than near term earnings noise.
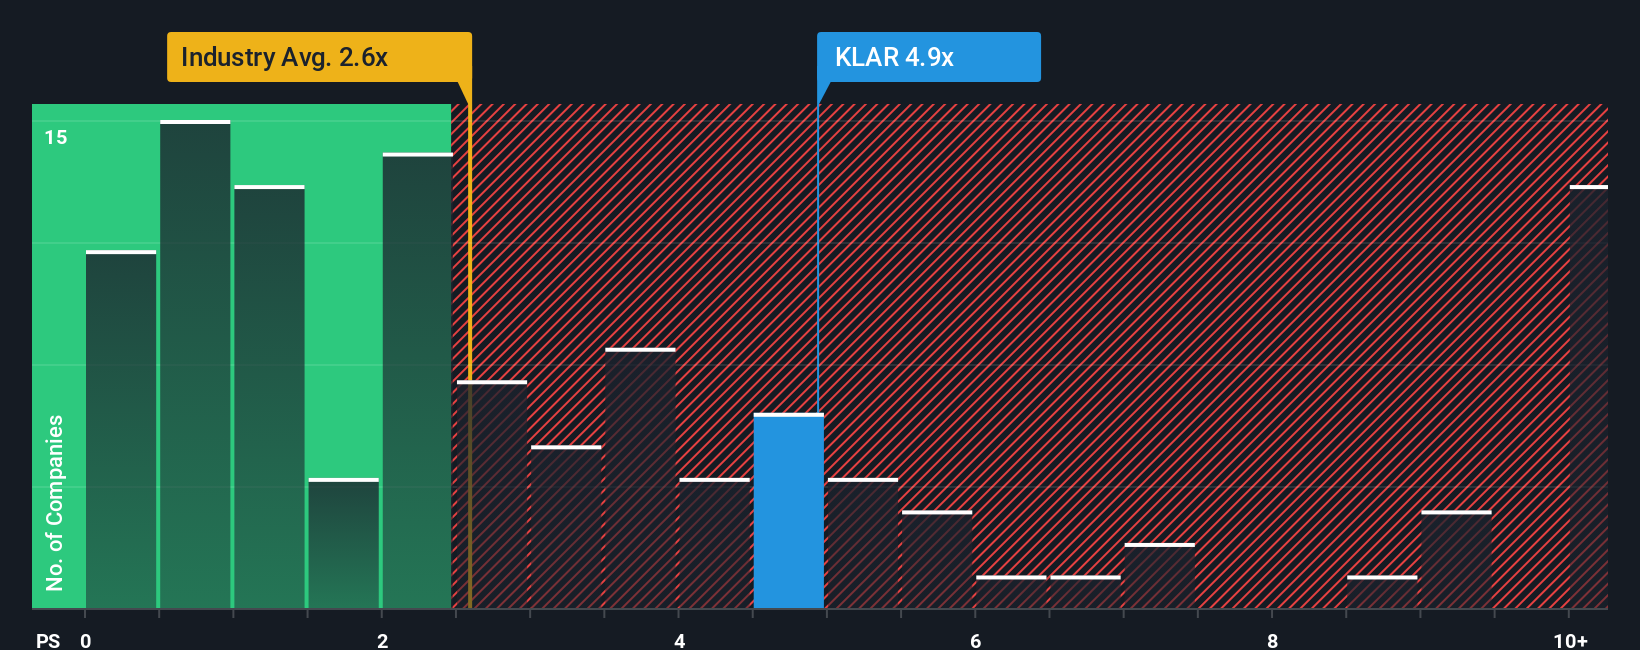
In broad terms, higher growth and lower perceived risk justify a richer price to sales multiple, while slower growth or more uncertainty usually demand a discount. With that in mind, Klarna currently trades on a price to sales ratio of about 3.66x. That is slightly below the 3.78x average for its peer group but sits meaningfully above the wider Diversified Financial industry average of around 2.57x, indicating investors are already paying a premium to the broader sector for Klarna’s growth story.
Simply Wall St’s Fair Ratio is designed to go a step further than simple peer or industry comparisons by estimating what multiple a stock should trade on after accounting for its specific growth outlook, profitability, risk profile, industry dynamics and market cap. On this framework, Klarna’s Fair Ratio comes out below its current 3.66x sales multiple, which suggests the shares are trading richer than is justified by these fundamentals.
Result: OVERVALUED
PS ratios tell one story, but what if the real opportunity lies elsewhere? Discover 1444 companies where insiders are betting big on explosive growth.
Upgrade Your Decision Making: Choose your Klarna Group Narrative
Earlier we mentioned that there is an even better way to understand valuation, so let us introduce you to Narratives, a simple way to connect your view of Klarna Group’s future with a clear fair value estimate. A Narrative is your story behind the numbers, where you spell out what you expect for Klarna’s future revenue, earnings and profit margins, and link that to what you think the shares are really worth. On Simply Wall St’s Community page, used by millions of investors, Narratives make this process accessible by turning those assumptions into a financial forecast and a fair value that you can easily compare to the current share price to help inform your decision. As new information arrives, such as earnings releases or major product announcements, Narratives can be updated so that your fair value view keeps evolving with the facts. For example, one Klarna Narrative might assume rapid revenue growth and higher margins and therefore arrive at a far higher fair value than another, more cautious Narrative that prices in slower growth and tighter regulation.
Do you think there's more to the story for Klarna Group? Head over to our Community to see what others are saying!
This article by Simply Wall St is general in nature. We provide commentary based on historical data and analyst forecasts only using an unbiased methodology and our articles are not intended to be financial advice. It does not constitute a recommendation to buy or sell any stock, and does not take account of your objectives, or your financial situation. We aim to bring you long-term focused analysis driven by fundamental data. Note that our analysis may not factor in the latest price-sensitive company announcements or qualitative material. Simply Wall St has no position in any stocks mentioned.
Have feedback on this article? Concerned about the content? Get in touch with us directly. Alternatively, email editorial-team@simplywallst.com