
 Nasdaq
 華爾街日報
華爾街日報Has The Market Reaction To Church & Dwight’s 18% Slide In 2025 Gone Too Far?
- Wondering if Church & Dwight is quietly turning into a bargain? This article will walk through whether the current price makes sense for long term investors or if patience is the smarter move.
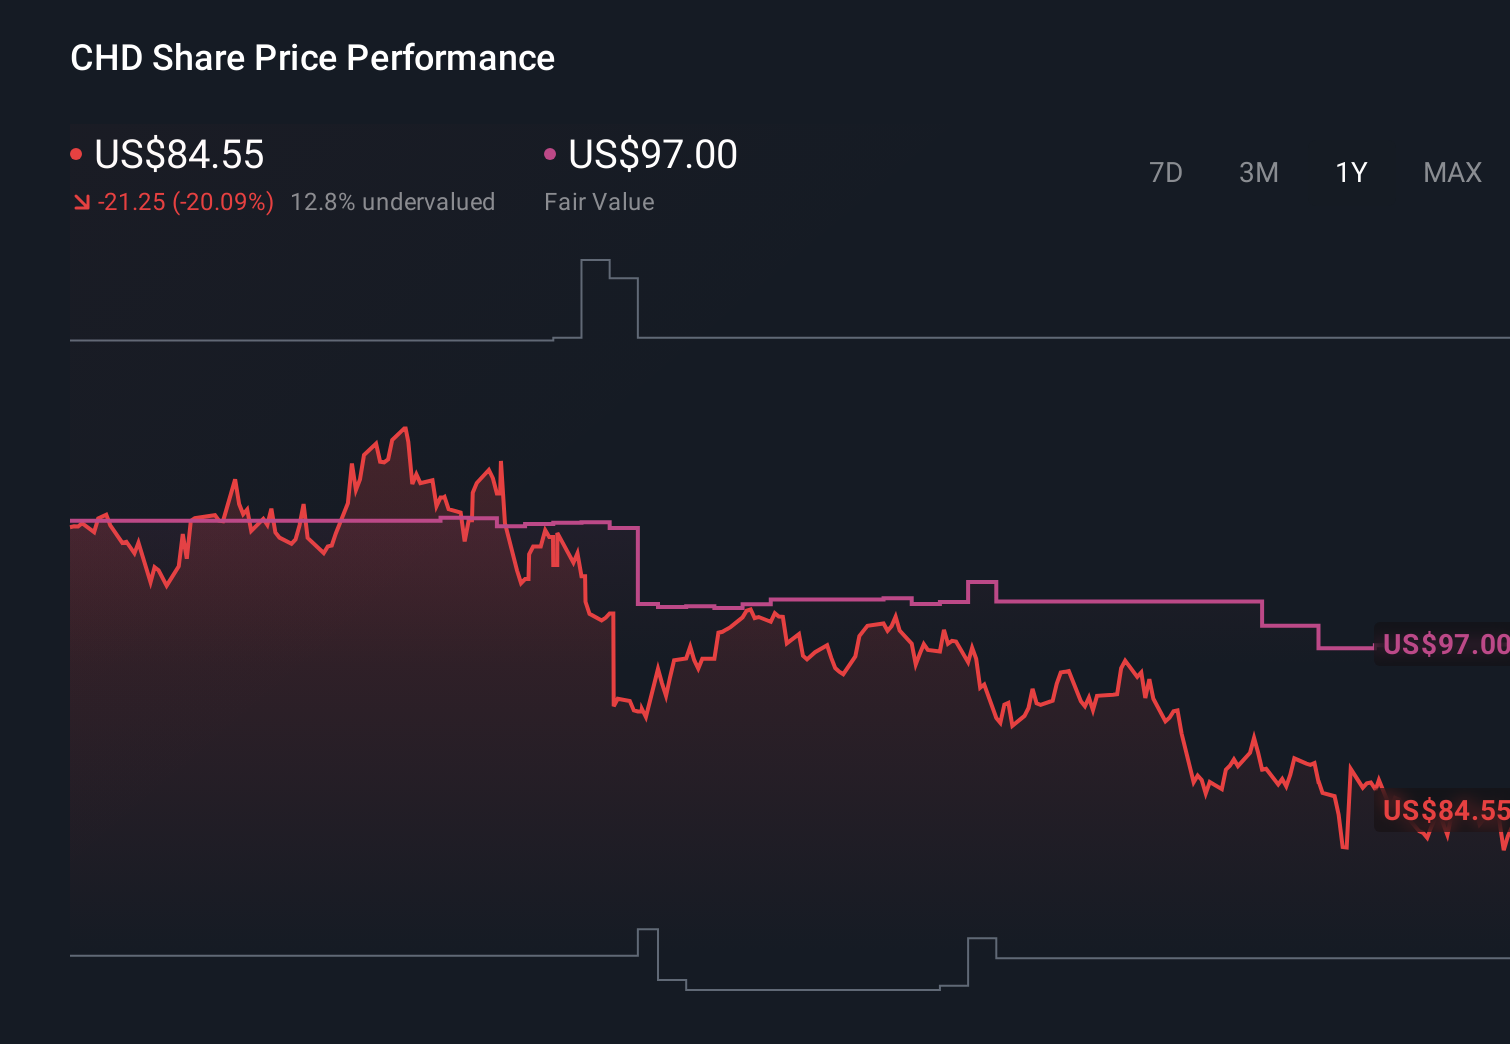
- The stock has drifted sideways in the short term, up just 0.1% over the last week and 0.6% over the past month, but it is still down about 18.5% year to date and 18.9% over the last year. This comes even though the three year return is a positive 9.4% and the five year return is 1.8%.
- Those muted but mixed returns come against a backdrop where investors are watching consumer staples names like Church & Dwight for resilience as inflation, rate uncertainty and shifting shopper behavior keep the broader market on edge. In that context, defensive brands with steady household demand can suddenly swing between being treated as safe havens or as fully priced, depending on how sentiment shifts.
- On our framework, Church & Dwight scores just 2 out of 6 on undervaluation checks. This suggests the market may not be offering a screaming discount yet, but the picture can change once you look at different valuation lenses. Next, we will break down those approaches to value in detail, then finish with an even more intuitive way to think about what the stock is really worth and when it may be mispriced.
Church & Dwight scores just 2/6 on our valuation checks. See what other red flags we found in the full valuation breakdown.
Approach 1: Church & Dwight Discounted Cash Flow (DCF) Analysis
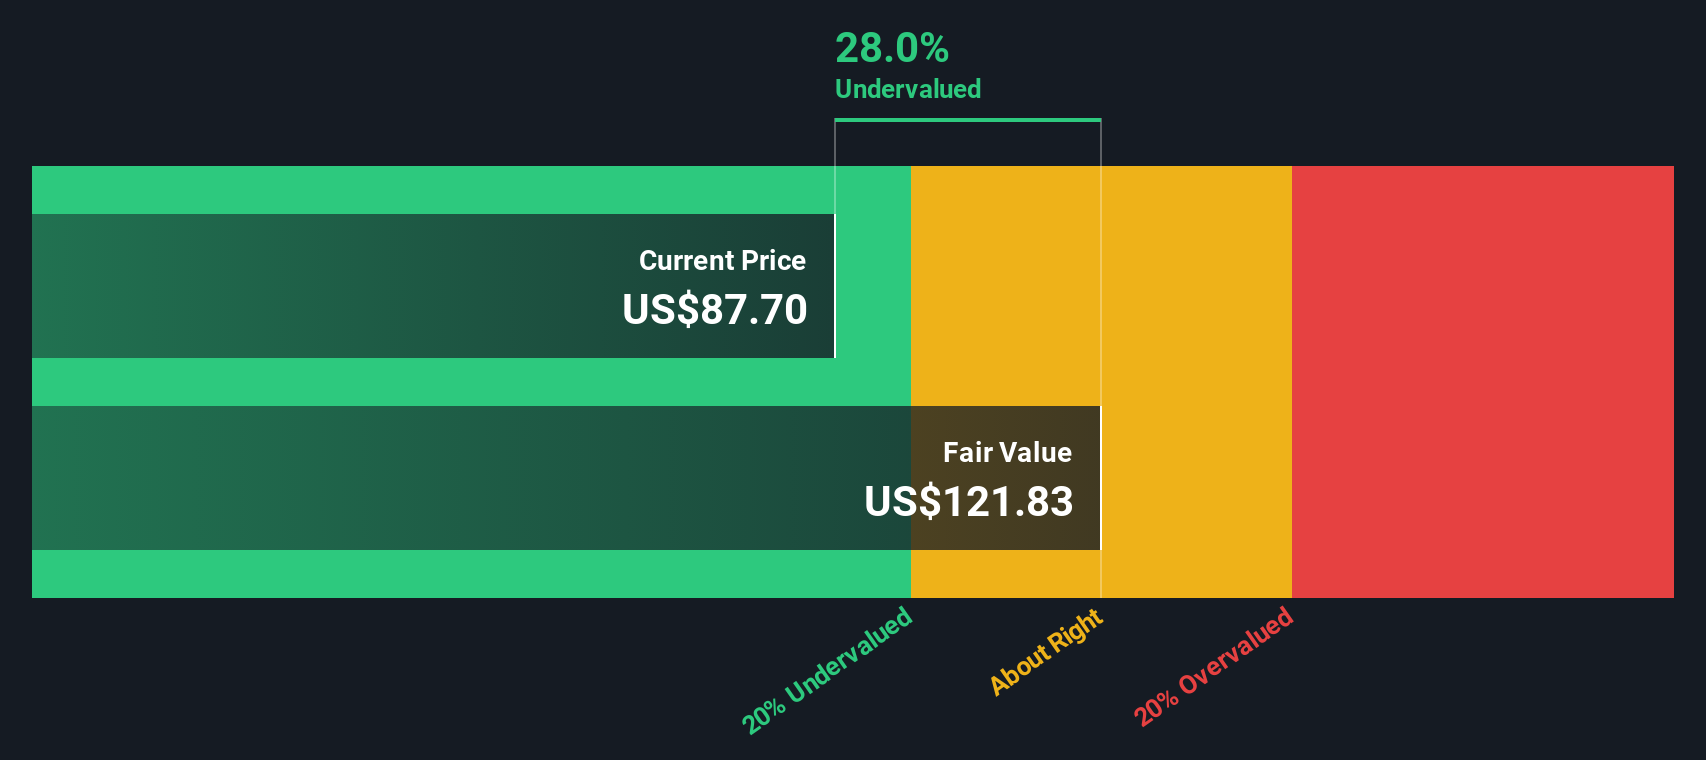
A Discounted Cash Flow model estimates what a business is worth by projecting the cash it can generate in the future and then discounting those cash flows back to today in dollar terms. For Church & Dwight, the 2 Stage Free Cash Flow to Equity model starts with last twelve month free cash flow of about $956 million and then layers on analyst expectations and longer term assumptions.
Analysts see free cash flow rising into the next decade, with projections reaching roughly $1.49 billion by 2035. Early years are based on explicit analyst forecasts, while the outer years are extrapolated by Simply Wall St using gradually moderating growth rates, which is typical for a mature household products company. When all of these projected cash flows are discounted back, the model arrives at an intrinsic value of about $125.03 per share.
Compared with the current share price, this implies Church & Dwight is trading at a 32.3% discount, suggesting the market is pricing in a weaker future than the cash flow outlook implies.
Result: UNDERVALUED
Our Discounted Cash Flow (DCF) analysis suggests Church & Dwight is undervalued by 32.3%. Track this in your watchlist or portfolio, or discover 904 more undervalued stocks based on cash flows.
Approach 2: Church & Dwight Price vs Earnings
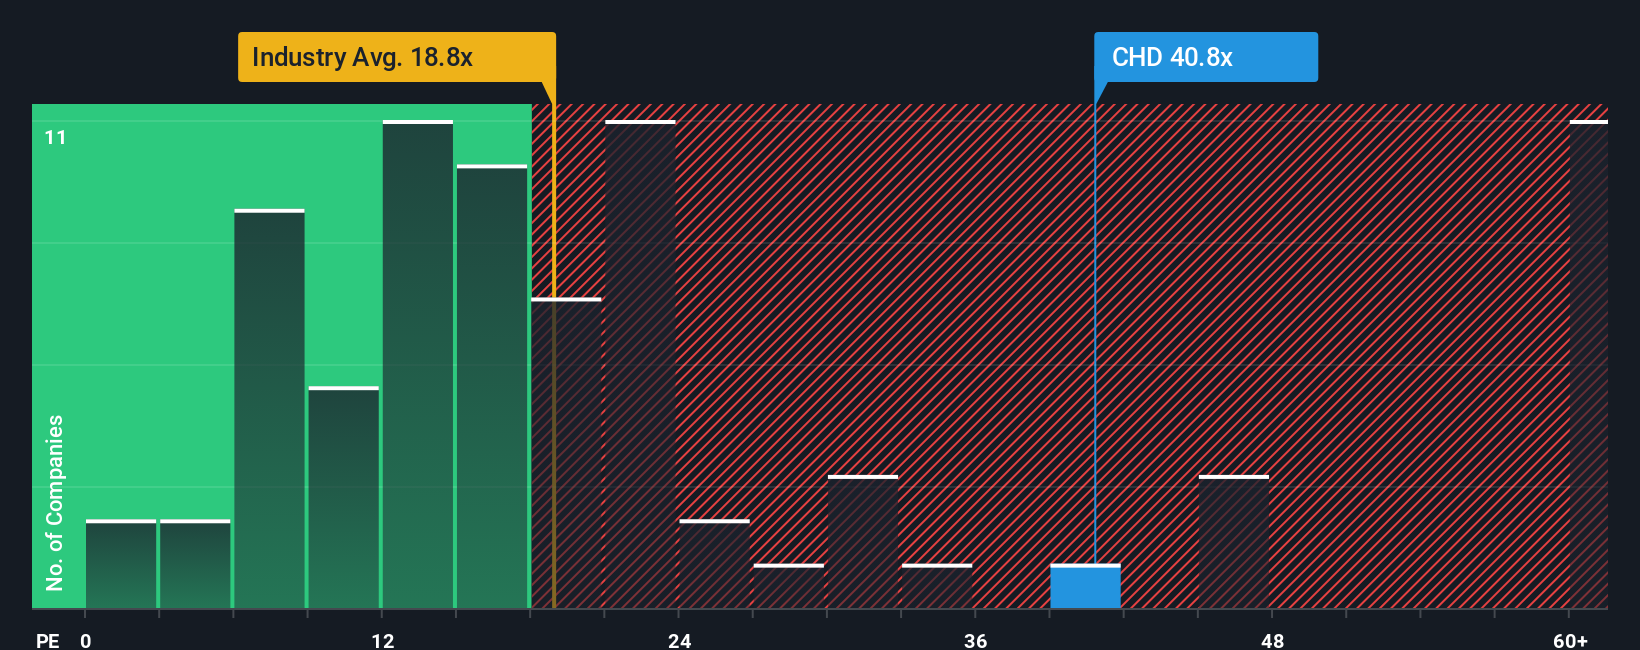
For a mature, consistently profitable business like Church & Dwight, the price to earnings (PE) ratio is a natural way to judge value because it directly compares what investors pay today with the company’s current earnings power. In general, faster growth and lower risk justify a higher PE, while slower growth, more cyclicality or elevated risk argue for a lower, more conservative multiple.
Church & Dwight currently trades at about 26.0x earnings, which is well above the Household Products industry average of roughly 17.4x and also higher than the peer group average of around 18.0x. On those simple comparisons, the stock looks expensive. However, Simply Wall St’s Fair Ratio framework goes a step further by estimating what a reasonable PE should be, given the company’s specific earnings growth outlook, profitability, industry position, market cap and risk profile.
That Fair Ratio for Church & Dwight is about 18.0x, noticeably below the current 26.0x. Because this tailored benchmark already adjusts for the company’s strengths and risks, the gap suggests investors are paying a premium multiple that is hard to justify on fundamentals alone, pointing to a stock that leans toward being overvalued on an earnings basis.
Result: OVERVALUED
PE ratios tell one story, but what if the real opportunity lies elsewhere? Discover 1444 companies where insiders are betting big on explosive growth.
Upgrade Your Decision Making: Choose your Church & Dwight Narrative
Earlier we mentioned that there is an even better way to understand valuation, so let us introduce you to Narratives, which are simple, story driven forecasts that let you explain why you think a company like Church & Dwight will grow the way it does, how its revenues, earnings and margins might evolve, and what that means for its fair value compared to today’s price.
A Narrative links three things together in one place: the company’s story, a set of financial forecasts, and a resulting fair value. This makes it easier to see how your view of Church & Dwight’s e commerce growth, wellness brands and margin pressures translates into numbers and, ultimately, an investment decision.
On Simply Wall St’s Community page, thousands of Narratives created by investors are available as easy, plug and play tools that automatically update when new earnings, news or guidance arrives. These can help you decide whether to buy, hold or sell by comparing each Narrative’s Fair Value with the current share price.
For example, one optimistic Church & Dwight Narrative might lean toward the $120 upper analyst target by assuming stronger online growth and expanding margins. A more cautious Narrative might anchor closer to $73 by focusing on input cost inflation, category slowdown and legacy brand risks. You can position your own view anywhere along that spectrum.
Do you think there's more to the story for Church & Dwight? Head over to our Community to see what others are saying!
This article by Simply Wall St is general in nature. We provide commentary based on historical data and analyst forecasts only using an unbiased methodology and our articles are not intended to be financial advice. It does not constitute a recommendation to buy or sell any stock, and does not take account of your objectives, or your financial situation. We aim to bring you long-term focused analysis driven by fundamental data. Note that our analysis may not factor in the latest price-sensitive company announcements or qualitative material. Simply Wall St has no position in any stocks mentioned.
Have feedback on this article? Concerned about the content? Get in touch with us directly. Alternatively, email editorial-team@simplywallst.com