
 Nasdaq
 華爾街日報
華爾街日報Is It Too Late To Consider TE Connectivity After Its 63% YTD Surge In 2025?
- Wondering if TE Connectivity is still worth buying after its big run up, or if you are turning up late to the party? This piece will walk through what the current price is really baking in.
- Even after a small pullback of around -1.8% over the last week and -3.0% over the past month, the stock is still up an impressive 63.7% year to date and 55.7% over the last year, more than doubling over three years and five years.
- Recent market interest has been shaped by TE Connectivity's positioning in key secular trends such as electric vehicles, industrial automation, and the broader shift toward connected devices, where demand for its connectors and sensors has remained resilient. At the same time, investors have been reassessing how much of that long term growth story is already reflected in the share price.
- Right now, TE Connectivity scores just 1/6 on our valuation checks, suggesting the market may be pricing in a lot of optimism. We will break down what different valuation approaches say about that. Stick around to the end, where we will not only compare those methods but also look at a more holistic way to interpret what valuation really means for this stock.
TE Connectivity scores just 1/6 on our valuation checks. See what other red flags we found in the full valuation breakdown.
Approach 1: TE Connectivity Discounted Cash Flow (DCF) Analysis
A Discounted Cash Flow model estimates what a company is worth by projecting its future cash flows and then discounting those back to today in $ terms. For TE Connectivity, the model starts with last twelve month free cash flow of about $3.3 billion and projects this to rise to roughly $3.9 billion by 2030, based on analyst forecasts for the next few years and then extrapolated growth thereafter.
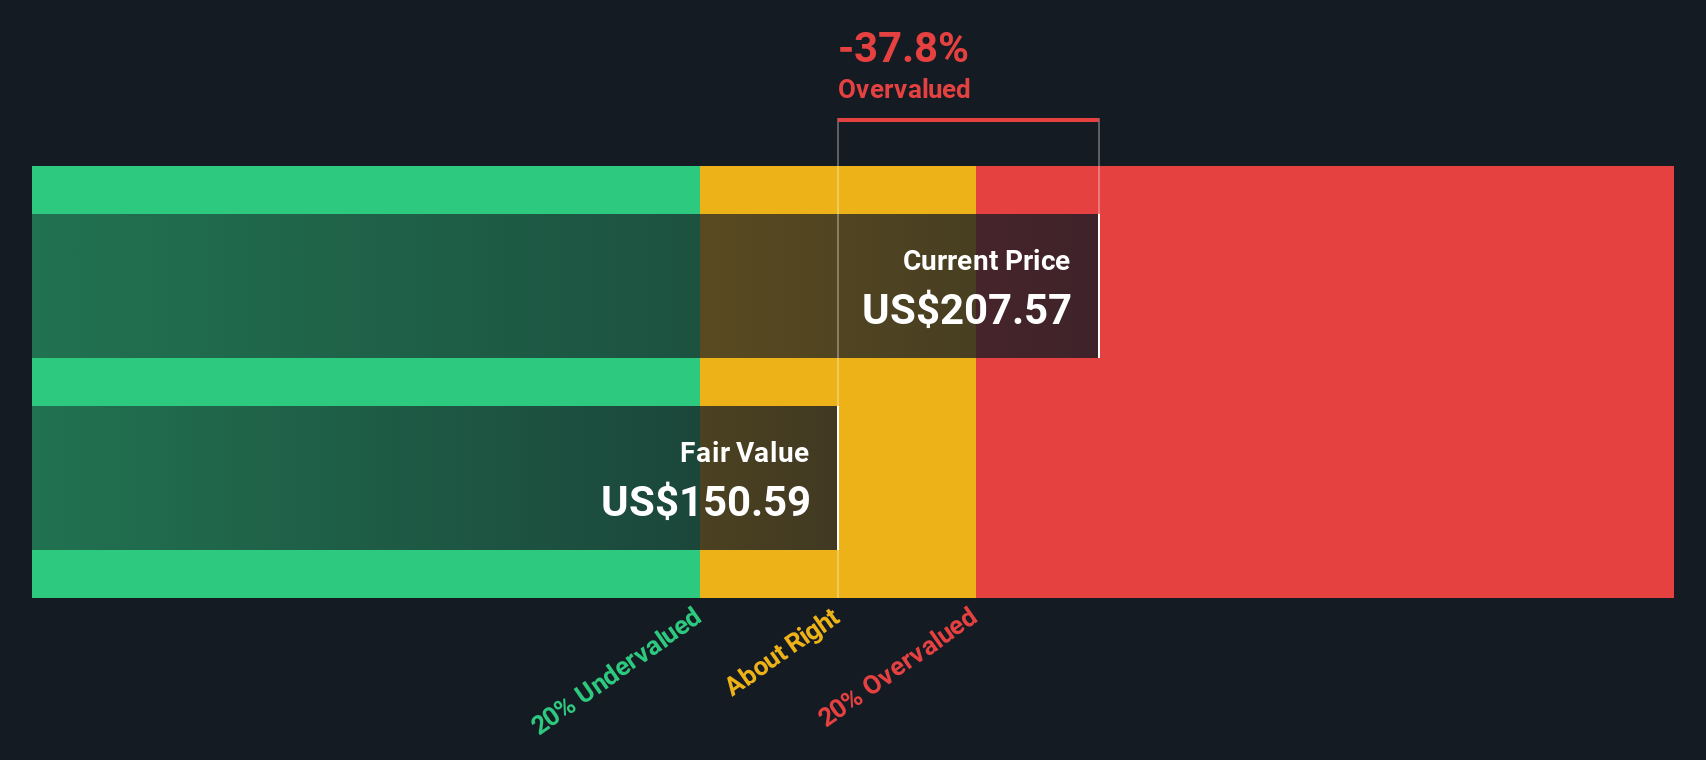
Using this 2 Stage Free Cash Flow to Equity approach, Simply Wall St arrives at an intrinsic value of about $187.79 per share. Compared with the current market price, the DCF suggests TE Connectivity is around 22.6% overvalued. This implies investors are already paying up for a good deal of the expected growth in electric vehicles, automation, and connected devices.
On this framework alone, the shares look priced for optimism rather than offering a clear margin of safety.
Result: OVERVALUED
Our Discounted Cash Flow (DCF) analysis suggests TE Connectivity may be overvalued by 22.6%. Discover 903 undervalued stocks or create your own screener to find better value opportunities.
Approach 2: TE Connectivity Price vs Earnings
For profitable companies like TE Connectivity, the price to earnings (P/E) ratio is a useful yardstick because it links what investors pay directly to the profits the business is generating today. A higher P/E can be justified when investors expect stronger growth or see the earnings as more reliable, while lower P/Es often reflect slower growth or higher perceived risk.
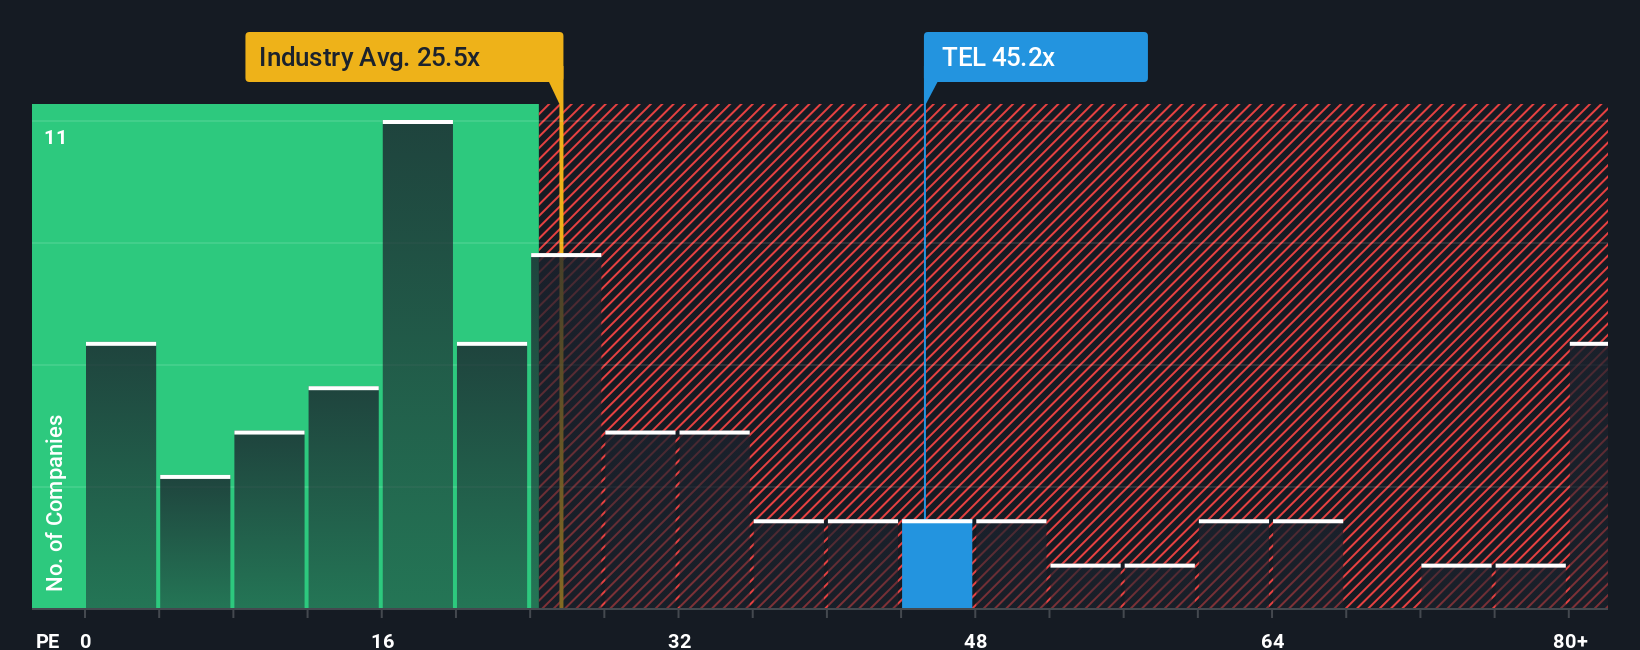
TE Connectivity currently trades on a P/E of about 36.7x. That is well above the broader Electronic industry average of roughly 24.8x, but broadly in line with its immediate peer group, which averages around 37.2x. To refine this picture, Simply Wall St uses a proprietary “Fair Ratio” model, which estimates what a reasonable P/E should be once factors like earnings growth, industry, profit margins, market cap, and company specific risks are taken into account.
On this basis, TE Connectivity’s Fair Ratio is 30.1x, below the current market multiple of 36.7x. That gap suggests investors are paying a premium well above what its fundamentals alone would typically support, even after considering its growth and quality profile.
Result: OVERVALUED
PE ratios tell one story, but what if the real opportunity lies elsewhere? Discover 1443 companies where insiders are betting big on explosive growth.
Upgrade Your Decision Making: Choose your TE Connectivity Narrative
Earlier we mentioned that there is an even better way to understand valuation, so let us introduce you to Narratives, a simple way to connect your view of TE Connectivity’s story to concrete forecasts for its future revenue, earnings, and margins, and then to your own fair value estimate.
A Narrative on Simply Wall St is essentially your investment storyline written in numbers. You set assumptions like growth rates, margins, and future valuation multiples that reflect how you think trends such as AI data centers, EV adoption, and grid upgrades will play out for TE Connectivity.
These Narratives live in the Community page on Simply Wall St and are used by millions of investors. They make it easy to see whether your Fair Value suggests the stock is a buy, hold, or sell when compared with the live market price.
They also update dynamically when new information arrives. If TE Connectivity posts stronger than expected earnings or announces a major contract, your Narrative’s forecast and Fair Value automatically reflect that change.
For example, one TE Connectivity Narrative might assume robust AI and EV driven growth and support a Fair Value near the top end of analyst targets around $247. A more cautious Narrative might lean closer to the low end near $155. Comparing both to the current price helps clarify whether you believe upside or downside is more likely right now.
Do you think there's more to the story for TE Connectivity? Head over to our Community to see what others are saying!

This article by Simply Wall St is general in nature. We provide commentary based on historical data and analyst forecasts only using an unbiased methodology and our articles are not intended to be financial advice. It does not constitute a recommendation to buy or sell any stock, and does not take account of your objectives, or your financial situation. We aim to bring you long-term focused analysis driven by fundamental data. Note that our analysis may not factor in the latest price-sensitive company announcements or qualitative material. Simply Wall St has no position in any stocks mentioned.
Have feedback on this article? Concerned about the content? Get in touch with us directly. Alternatively, email editorial-team@simplywallst.com