
 Nasdaq
 華爾街日報
華爾街日報Reassessing Alstom’s Valuation After Recent Contract Wins and Share Price Rebound
- Wondering if Alstom is a quietly mispriced opportunity or a value trap in plain sight? Let us break down what the market is really implying about this stock right now.
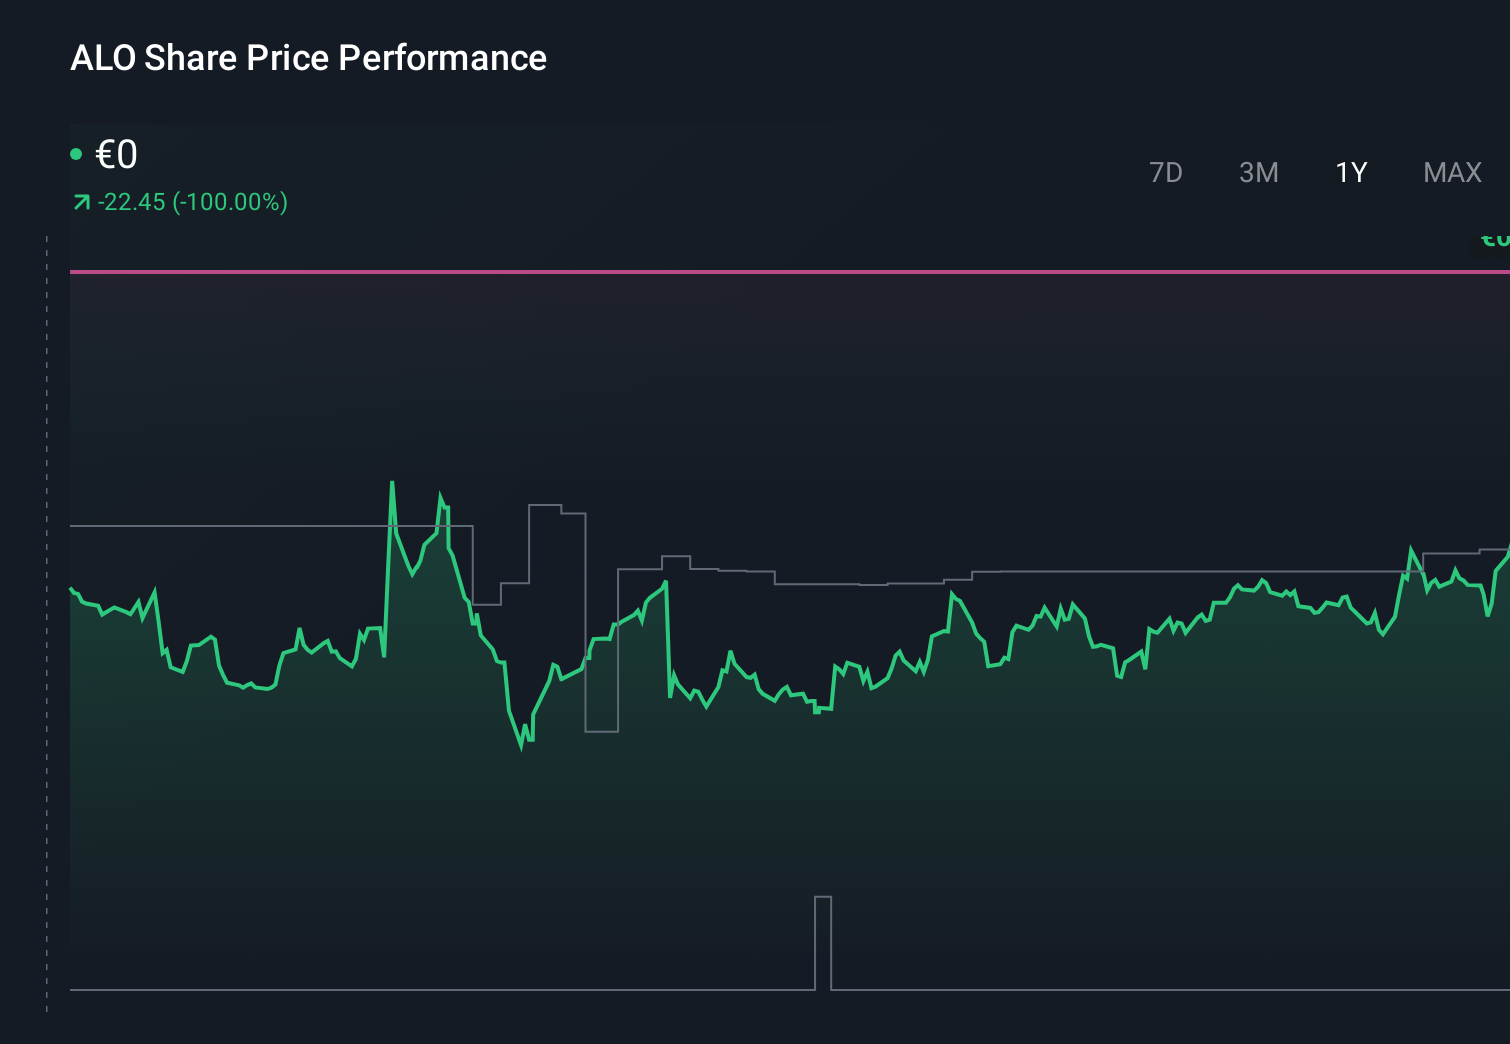
- Alstom's share price has climbed 5.6% over the last week and 10.6% year to date, though it is still down 42.5% over five years, a mix that hints at shifting sentiment and fresh expectations.
- Recent headlines have focused on Alstom's progress on major rail and rolling stock contracts, as well as ongoing efforts to streamline its portfolio and improve its balance sheet. Together, these moves help explain why investors are revisiting the story even after years of lacklustre returns.
- Despite this renewed interest, Alstom scores just 0/6 on our valuation checks, which suggests the usual metrics see little margin of safety. Next, we will unpack what those different valuation approaches say about the stock, and later we will explore a more powerful way to think about Alstom's true value beyond the standard models.
Alstom scores just 0/6 on our valuation checks. See what other red flags we found in the full valuation breakdown.
Approach 1: Alstom Discounted Cash Flow (DCF) Analysis
A Discounted Cash Flow model estimates what a company is worth by projecting the cash it could generate in the future and then discounting those cash flows back into today’s euros.
For Alstom, the most recent twelve month Free Cash Flow is negative at about €132 million, which means the business is currently consuming rather than generating cash. Analysts expect this to improve, with projected Free Cash Flow rising to roughly €375 million by 2030. The path to that point is uneven, with forecasts peaking near the late 2020s before moderating as Simply Wall St extrapolates beyond the formal analyst horizon.
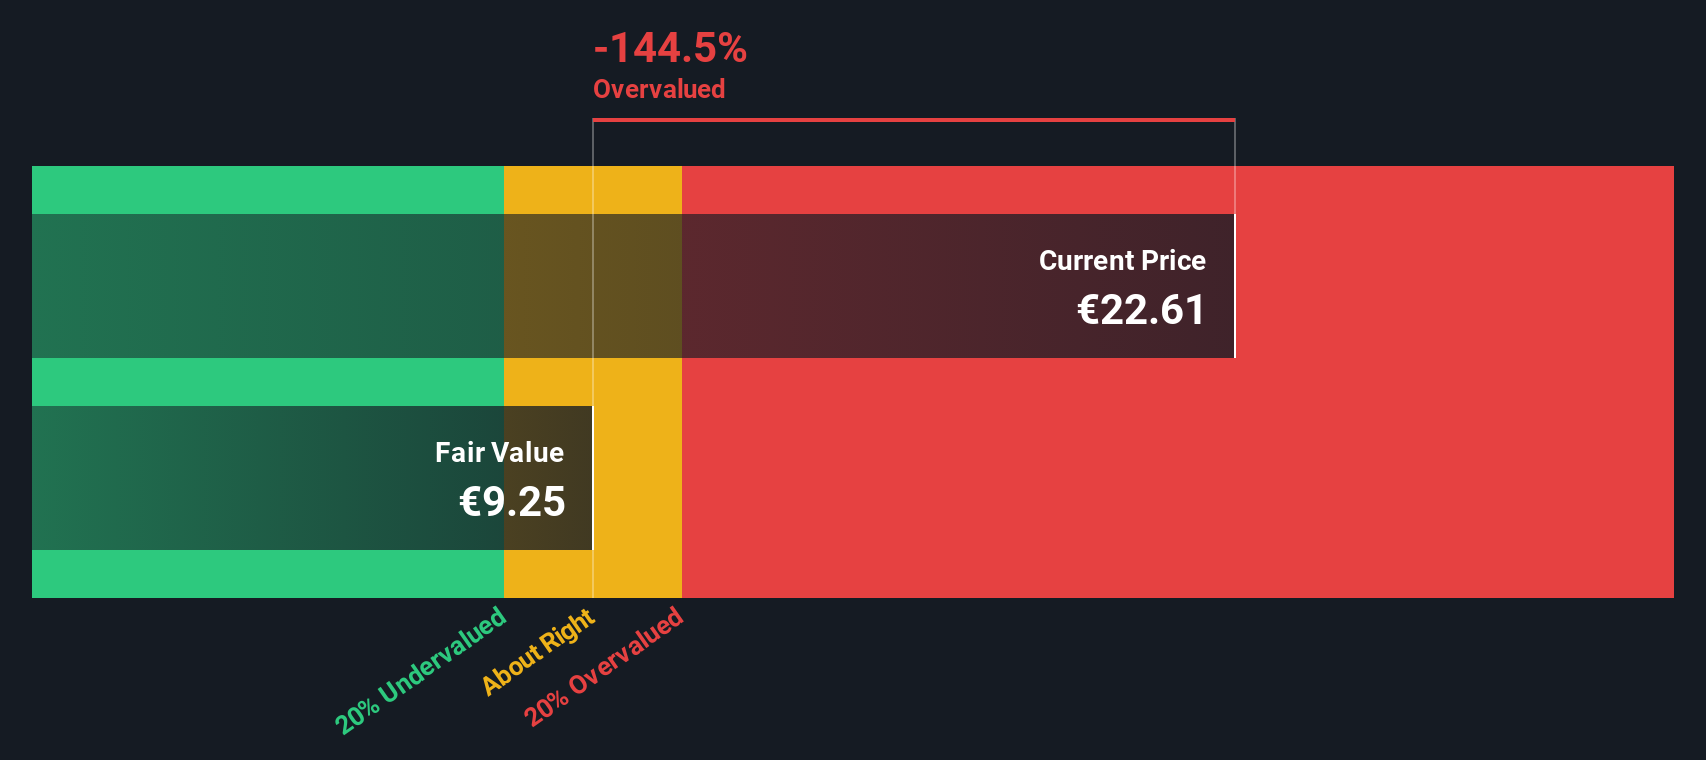
When those future cash flows are discounted back to today under a two stage Free Cash Flow to Equity model, the resulting intrinsic value for Alstom is about €9.23 per share. Compared with the current market price, this implies the stock is roughly 163.2% overvalued on a pure cash flow basis, suggesting investors are paying far ahead of the model’s fundamentals.
Result: OVERVALUED
Our Discounted Cash Flow (DCF) analysis suggests Alstom may be overvalued by 163.2%. Discover 903 undervalued stocks or create your own screener to find better value opportunities.
Approach 2: Alstom Price vs Earnings
For companies that are generating positive profits, the price to earnings, or PE, ratio is often the cleanest way to compare what investors are paying for each unit of earnings. It captures, in a single number, how the market is weighing a company’s current profitability against its future prospects.
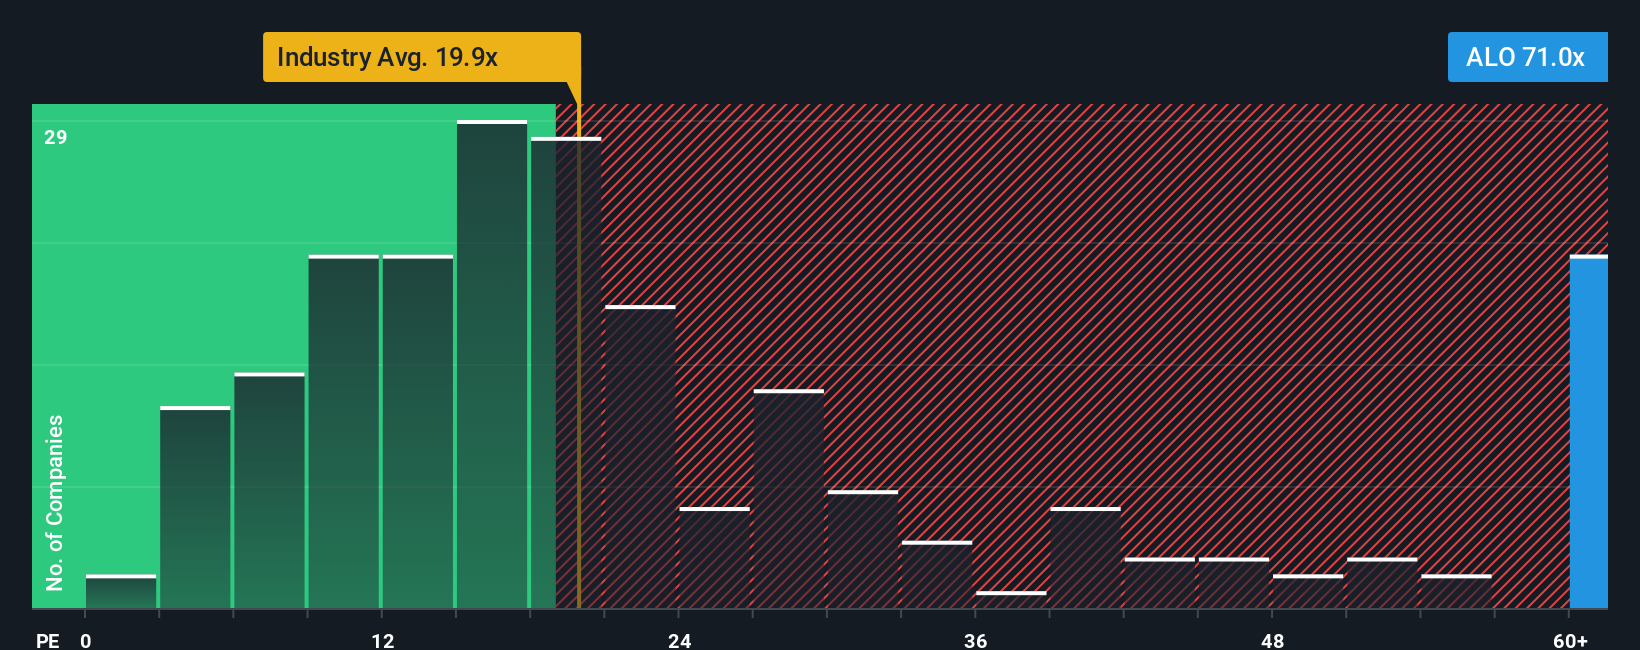
In practice, faster growing and lower risk businesses usually deserve a higher PE ratio, while slower growth or higher uncertainty tend to cap what investors are willing to pay. Alstom currently trades on about 36.7x earnings, which is well above both the wider Machinery industry average of roughly 23.8x and a peer group average around 19.3x. That gap suggests the market is already pricing in stronger growth or a cleaner risk profile than many of its closest comparables.
Simply Wall St’s Fair Ratio framework refines this by estimating what PE multiple Alstom should trade on, given its specific combination of earnings growth, profit margins, industry, size and risk factors. This makes it more tailored than simple peer or industry comparisons, which can overlook important company level nuances. Alstom’s Fair Ratio is about 32.1x, meaning the current 36.7x multiple sits meaningfully above what the model considers reasonable for its fundamentals.
Result: OVERVALUED
PE ratios tell one story, but what if the real opportunity lies elsewhere? Discover 1443 companies where insiders are betting big on explosive growth.
Upgrade Your Decision Making: Choose your Alstom Narrative
Earlier we mentioned that there is an even better way to understand valuation, so let us introduce you to Narratives, an intuitive framework on Simply Wall St’s Community page where you connect your view of a company’s story with a simple financial forecast and a resulting fair value, then compare that fair value to today’s share price to help you think about whether to buy, hold or sell.
Instead of relying only on static models like DCFs or PE multiples, a Narrative lets you spell out why you think Alstom’s orders, margins, risks and leadership changes will shape its future, translate those beliefs into expected revenue, earnings and profit margins, and then see the fair value that results from those assumptions.
Narratives are dynamic and update as fresh information like earnings releases, new contracts or guidance changes come in. This means your Alstom view can automatically shift from, for example, a scenario that sees fair value closer to €33 to a far more cautious stance that anchors around €9 when execution risks or weaker markets dominate your thinking.
Do you think there's more to the story for Alstom? Head over to our Community to see what others are saying!
This article by Simply Wall St is general in nature. We provide commentary based on historical data and analyst forecasts only using an unbiased methodology and our articles are not intended to be financial advice. It does not constitute a recommendation to buy or sell any stock, and does not take account of your objectives, or your financial situation. We aim to bring you long-term focused analysis driven by fundamental data. Note that our analysis may not factor in the latest price-sensitive company announcements or qualitative material. Simply Wall St has no position in any stocks mentioned.
Have feedback on this article? Concerned about the content? Get in touch with us directly. Alternatively, email editorial-team@simplywallst.com