
 Nasdaq
 華爾街日報
華爾街日報Sabine Royalty Trust (SBR): Valuation Check After New Production Update and Cash Distribution Announcement
Sabine Royalty Trust (SBR) just paired fresh December production figures with a new cash distribution, giving income-focused investors a clear snapshot of both current output and near term payout momentum.
See our latest analysis for Sabine Royalty Trust.
Despite the latest update, Sabine Royalty Trust’s unit price has eased back to $69.03, with softer recent share price returns but a still solid one year total shareholder return suggesting momentum is cooling rather than collapsing.
If Sabine’s distribution story has you reassessing income ideas, it could be a good moment to broaden your search and discover fast growing stocks with high insider ownership.
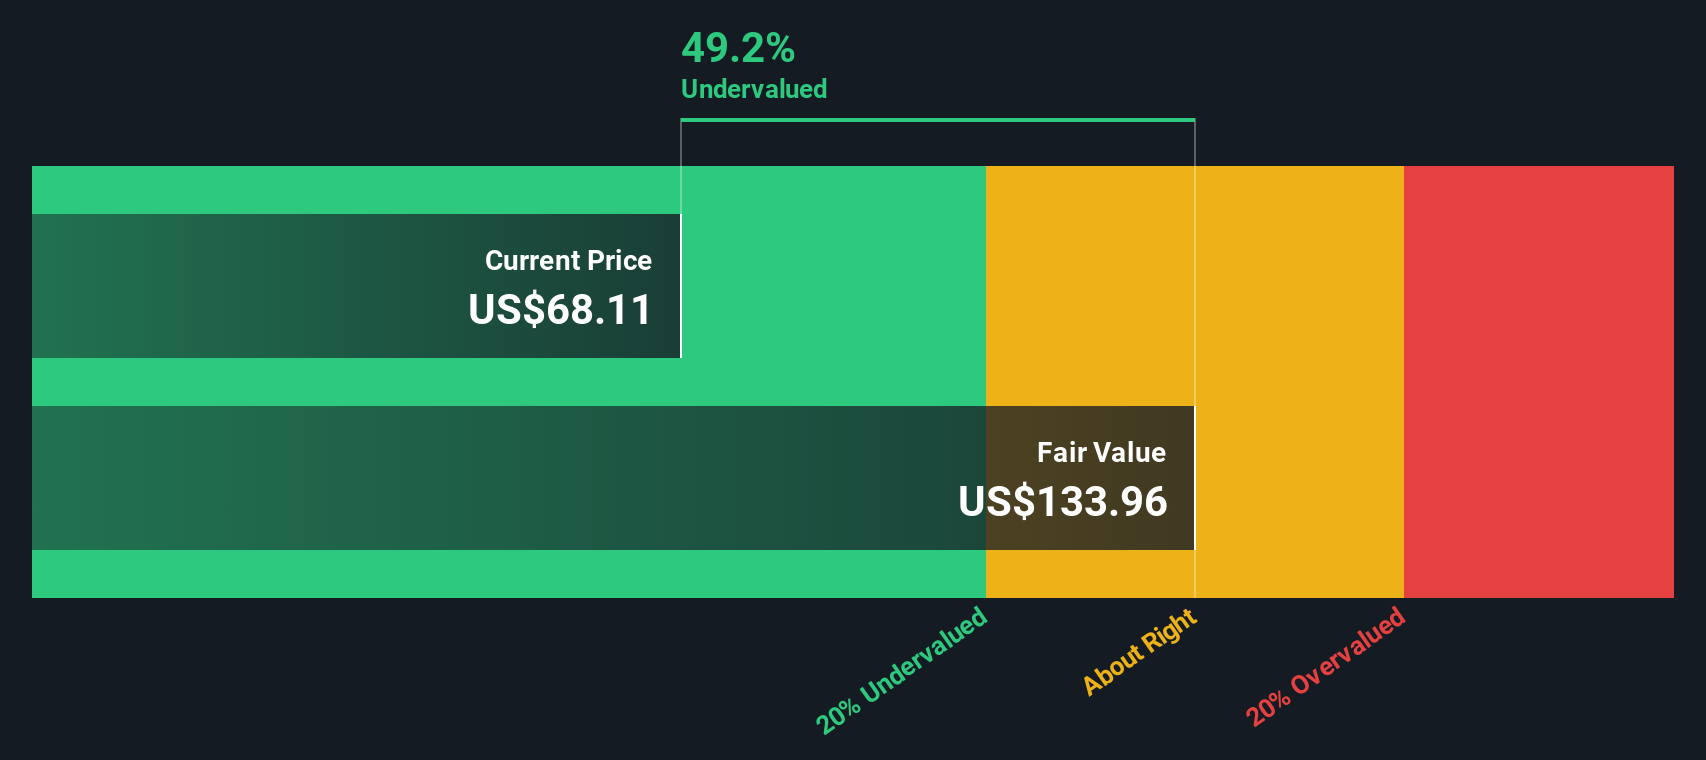
With units trading well below some intrinsic value estimates yet offering robust long term total returns, the key question now is whether Sabine is quietly undervalued or if the market is already pricing in its future growth.
Price-to-Earnings of 12.7x: Is it justified?
Sabine Royalty Trust looks inexpensive on a headline valuation basis, with its 12.7x Price to Earnings ratio sitting well below peers despite the $69.03 unit price.
The Price to Earnings ratio compares the current unit price to the trust’s earnings per unit. It is a useful shorthand for how much investors are paying for each dollar of profits in a mature, cash generative oil and gas royalty vehicle.
In Sabine’s case, that 12.7x multiple screens as good value versus both the broader US Oil and Gas industry average of 13.5x and a peer group average of 32.9x. This suggests the market is pricing its earnings stream more conservatively than many comparable names despite high quality profitability and an extensive portfolio of producing assets.
See what the numbers say about this price — find out in our valuation breakdown.
Result: Price-to-Earnings of 12.7x (UNDERVALUED)
However, softer recent unit price momentum and Sabine’s dependence on inherently volatile oil and gas prices could quickly challenge the apparent value case.
Find out about the key risks to this Sabine Royalty Trust narrative.
Another View on Value
While Sabine looks cheap on earnings, our DCF model paints an even starker picture, with units trading around $69.03 versus an estimated fair value of $139.73, which implies it may be deeply undervalued. Is the market missing something in the cash flow outlook, or just being cautious?
Look into how the SWS DCF model arrives at its fair value.
Simply Wall St performs a discounted cash flow (DCF) on every stock in the world every day (check out Sabine Royalty Trust for example). We show the entire calculation in full. You can track the result in your watchlist or portfolio and be alerted when this changes, or use our stock screener to discover 903 undervalued stocks based on their cash flows. If you save a screener we even alert you when new companies match - so you never miss a potential opportunity.
Build Your Own Sabine Royalty Trust Narrative
If you see the story differently or prefer to dig into the numbers yourself, you can shape a complete view in minutes: Do it your way.
A great starting point for your Sabine Royalty Trust research is our analysis highlighting 1 key reward and 1 important warning sign that could impact your investment decision.
Ready for your next smart idea?
Sabine might be appealing, but you could miss stronger opportunities if you stop here. Let the numbers point you toward other compelling setups in minutes.
- Capture potential mispricings by targeting companies trading below their intrinsic worth using these 903 undervalued stocks based on cash flows before the broader market catches on.
- Ride structural growth trends by focusing on innovators harnessing intelligent automation and data with these 26 AI penny stocks while adoption is still accelerating.
- Strengthen your income stream by screening for reliable payers through these 13 dividend stocks with yields > 3% and avoid scrambling for yield when markets turn choppy.
This article by Simply Wall St is general in nature. We provide commentary based on historical data and analyst forecasts only using an unbiased methodology and our articles are not intended to be financial advice. It does not constitute a recommendation to buy or sell any stock, and does not take account of your objectives, or your financial situation. We aim to bring you long-term focused analysis driven by fundamental data. Note that our analysis may not factor in the latest price-sensitive company announcements or qualitative material. Simply Wall St has no position in any stocks mentioned.
Have feedback on this article? Concerned about the content? Get in touch with us directly. Alternatively, email editorial-team@simplywallst.com