
 Nasdaq
 華爾街日報
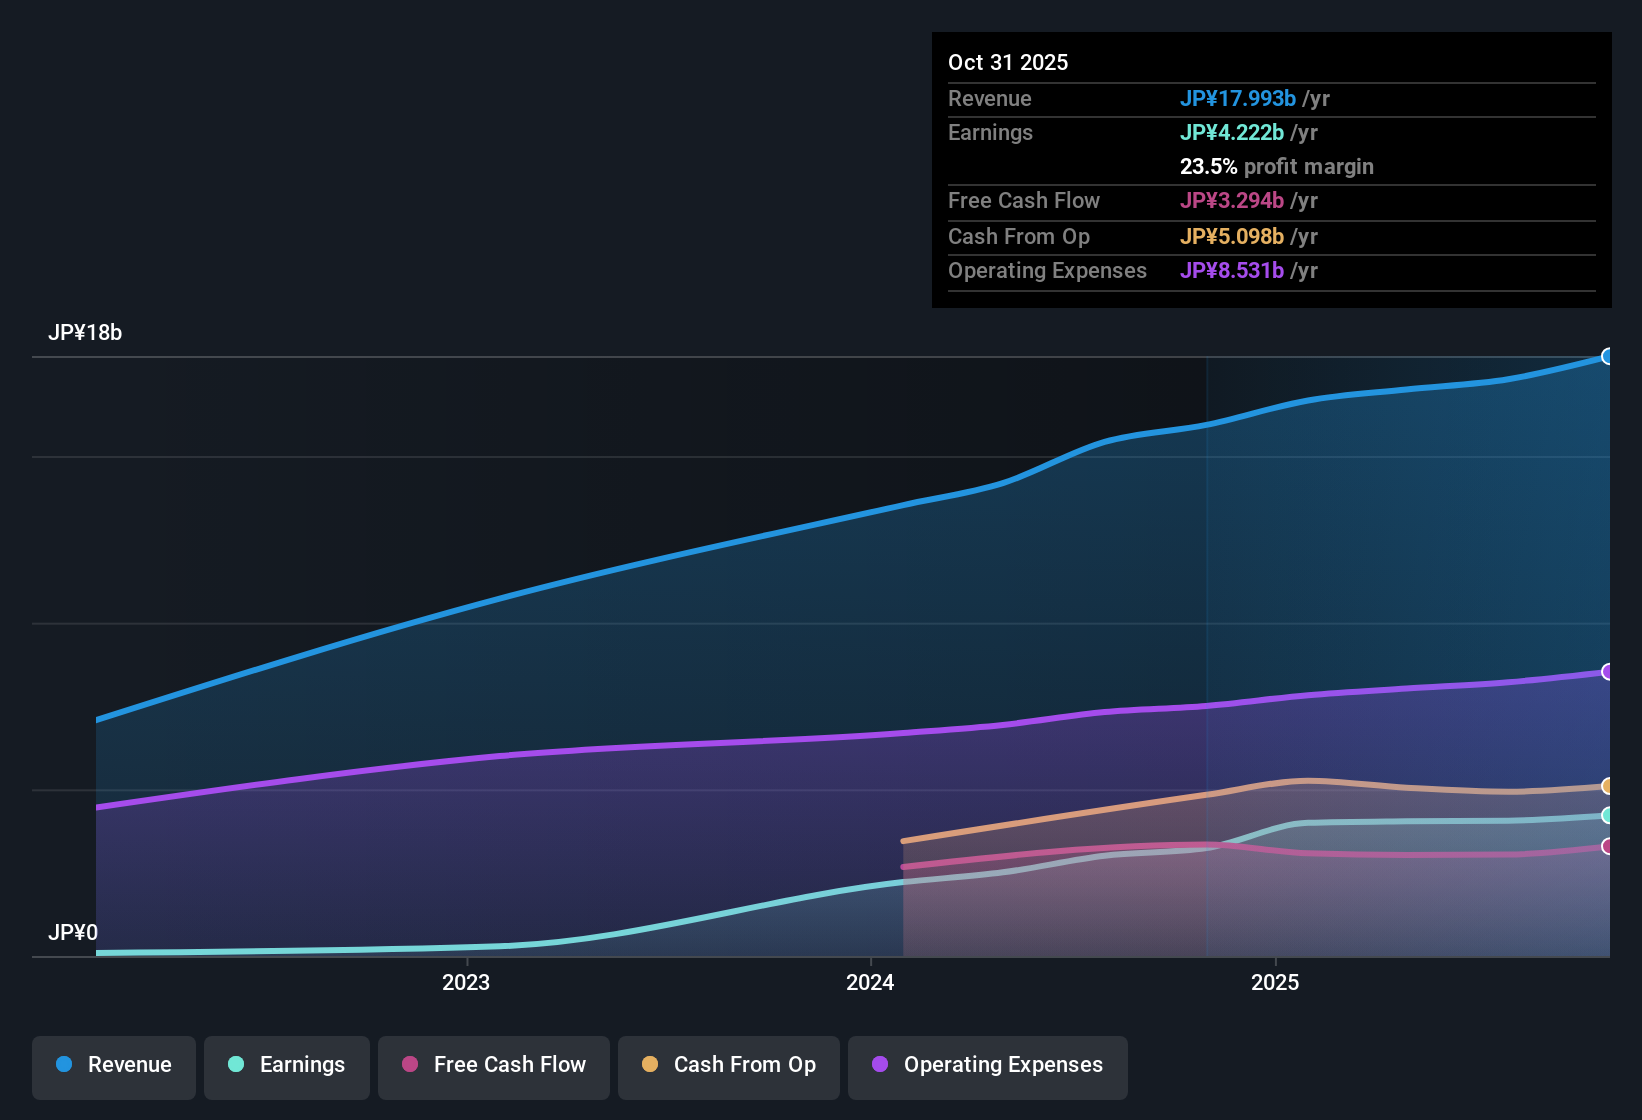
華爾街日報Japan Eyewear Holdings (TSE:5889) Margin Expansion Backs Bullish Growth Narrative in Q3 2026
Japan Eyewear Holdings (TSE:5889) has posted its Q3 2026 numbers, with revenue at approximately ¥4.5 billion and basic EPS of ¥37.6, while trailing 12 month EPS stands at ¥175.1 on revenue of about ¥18.0 billion. The company has seen revenue move from roughly ¥15.9 billion to ¥18.0 billion on a trailing 12 month basis, alongside EPS rising from ¥135.5 to ¥175.1. This sets up this quarter as part of a steady earnings run that keeps investor attention squarely on how margins are evolving.
See our full analysis for Japan Eyewear Holdings.With the headline figures on the table, the next step is to see how this earnings run lines up with the dominant narratives around growth, quality and sustainability that investors have been debating.
Curious how numbers become stories that shape markets? Explore Community Narratives
Margins Strengthen With 23.5% Net Profit Level
- Over the last 12 months, net profit margin sat at 23.5 percent compared with 20.3 percent a year earlier, pointing to more of every yen of the roughly ¥18.0 billion in trailing revenue turning into profit.
- What stands out for the bullish view is that this higher margin sits on top of strong trailing earnings power, with net income over the last year of ¥4,222 million and basic EPS of ¥175.1. Together, these figures show the business converting sales into profit more efficiently than it did when net profit margin was 20.3 percent.
Revenue Growth Outpaces Japan Market
- Trailing 12 month revenue rose from about ¥15.9 billion to ¥18.0 billion, and forward estimates call for revenue growth of 11.8 percent per year compared with 4.6 percent for the wider Japan market.
- Supporters of a bullish angle argue this kind of above market growth profile is attractive, and the numbers do lean that way, with earnings having grown 30.3 percent over the past year and averaging 46.3 percent per year over five years, even though the latest single quarter shows some normal variation as Q3 2026 revenue of ¥4,485 million sits below ¥4,746 million in Q2 2026.
Even if future growth slows from the five year pace, many bulls see a business that is still forecast to grow faster than the broader Japanese market, which is a useful starting point when you are thinking about how long current profitability can be maintained. 📊 Read the full Japan Eyewear Holdings Consensus Narrative.
Valuation Looks Modest Versus Growth Profile
- At a share price of ¥2,048, the company trades at 11.7 times trailing earnings and roughly 45.3 percent below a DCF fair value of about ¥3,744.1, while peers and the wider industry sit on P E ratios around 14 to 15 times.
- What is interesting for value focused investors is how this discount lines up against the growth and margin story, because the stock is priced below peer and industry earnings multiples at the same time that forecasts call for earnings growth of 11.2 percent per year and revenue growth of 11.8 percent. Yet the balance sheet still carries a relatively high level of debt, which investors need to weigh alongside the apparent valuation gap.
Next Steps
Don't just look at this quarter; the real story is in the long-term trend. We've done an in-depth analysis on Japan Eyewear Holdings's growth and its valuation to see if today's price is a bargain. Add the company to your watchlist or portfolio now so you don't miss the next big move.
See What Else Is Out There
Despite solid growth and improving margins, Japan Eyewear Holdings still carries relatively high debt, which could constrain flexibility if conditions or execution turn against it.
If that level of leverage makes you uneasy, use our solid balance sheet and fundamentals stocks screener (1943 results) to quickly refocus on companies with stronger safety nets and more resilient financial foundations.
This article by Simply Wall St is general in nature. We provide commentary based on historical data and analyst forecasts only using an unbiased methodology and our articles are not intended to be financial advice. It does not constitute a recommendation to buy or sell any stock, and does not take account of your objectives, or your financial situation. We aim to bring you long-term focused analysis driven by fundamental data. Note that our analysis may not factor in the latest price-sensitive company announcements or qualitative material. Simply Wall St has no position in any stocks mentioned.
Have feedback on this article? Concerned about the content? Get in touch with us directly. Alternatively, email editorial-team@simplywallst.com