
 Nasdaq
 華爾街日報
華爾街日報Is Northwest Bancshares a Hidden Value Opportunity After Its Recent Share Price Rebound?
- If you have been wondering whether Northwest Bancshares is quietly turning into a value opportunity or just another sleepy regional bank, you are in the right place.
- The stock has nudged higher recently, up 4.7% over the last week and 7.7% over the past month, even though it is still slightly down year to date and over the last year.
- That uptick has come as investors refocus on regional banks that look relatively well positioned for a stabilizing rate environment and more predictable credit trends. Northwest Bancshares has been part of that conversation as a steady, income oriented name that could benefit if sentiment toward smaller financials continues to thaw.
- Right now, Northwest Bancshares scores just 2 out of 6 on our valuation checks, suggesting pockets of value but also areas where the market may be more cautious. Next, we will walk through the usual valuation tools investors rely on and then circle back to a more holistic way of thinking about what the stock is really worth.
Northwest Bancshares scores just 2/6 on our valuation checks. See what other red flags we found in the full valuation breakdown.
Approach 1: Northwest Bancshares Excess Returns Analysis
The Excess Returns model looks at how much value Northwest Bancshares can create above the minimum return shareholders require, and then capitalizes those excess profits into an intrinsic value per share.
For Northwest Bancshares, the starting point is its book value of $12.70 per share and a stable earnings power of $1.25 per share, based on weighted future Return on Equity estimates from five analysts. With an average Return on Equity of 9.39% and a stable book value expected to drift up to $13.32 per share, the bank is projected to keep generating returns above its estimated cost of equity of $0.93 per share.
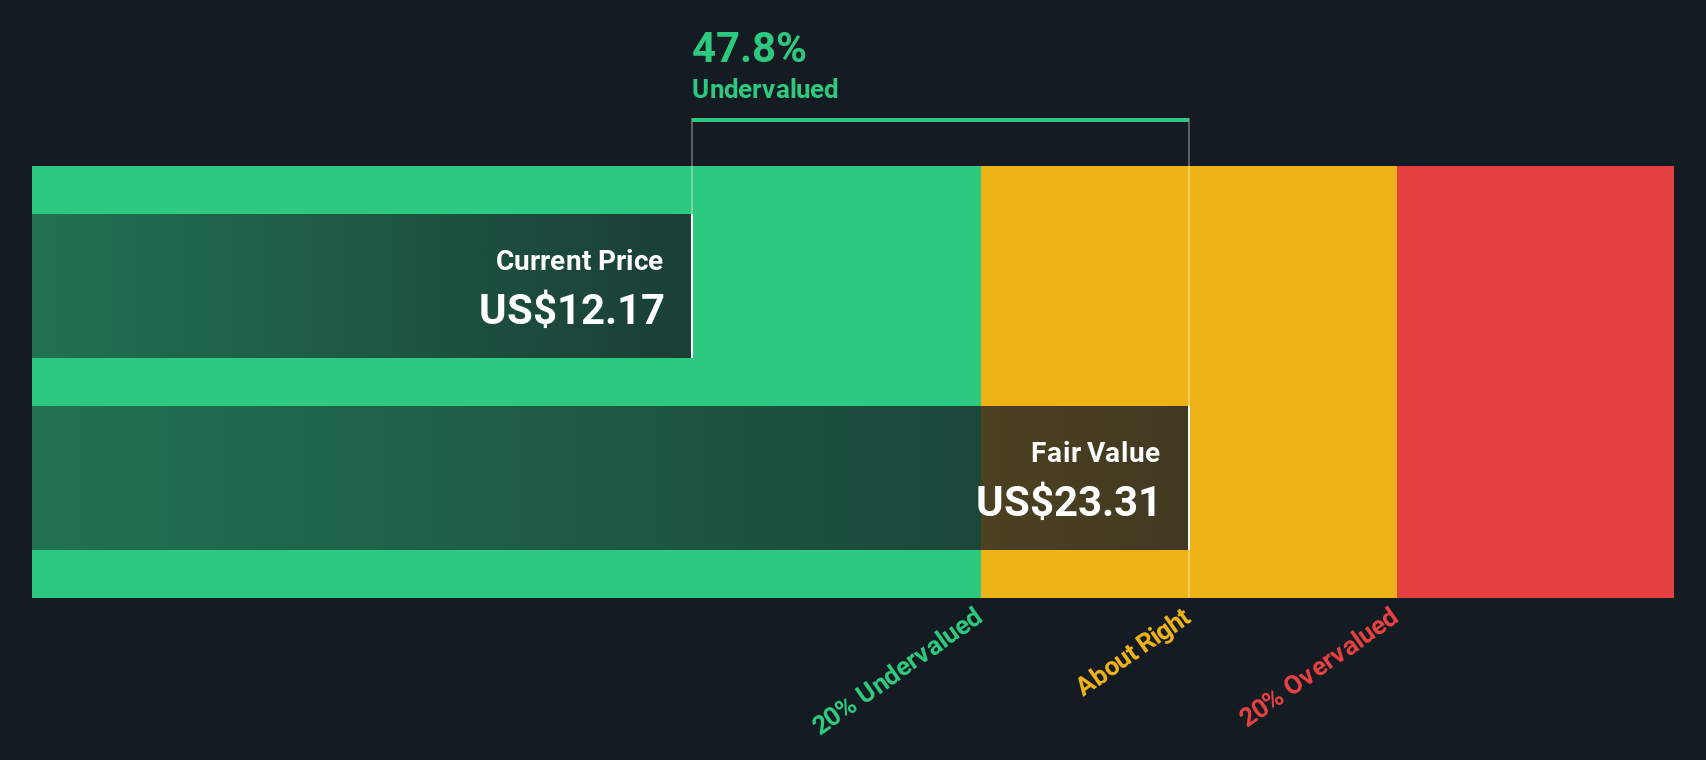
The difference between what the bank earns on equity and what investors demand, its excess return of $0.32 per share, is then projected forward and discounted back. This process yields an Excess Returns fair value estimate of about $22.10 per share. Compared with the current share price, that implies roughly a 42.4% discount, suggesting the market is not fully pricing in Northwest Bancshares steady profitability.
Result: UNDERVALUED
Our Excess Returns analysis suggests Northwest Bancshares is undervalued by 42.4%. Track this in your watchlist or portfolio, or discover 907 more undervalued stocks based on cash flows.
Approach 2: Northwest Bancshares Price vs Earnings
For a consistently profitable bank like Northwest Bancshares, the Price to Earnings, or PE, ratio is a sensible yardstick because it links what investors pay today to the cash generating power of the business. In general, companies with stronger growth prospects and lower perceived risk can justify higher PE multiples, while slower growing or riskier names usually trade at a discount.
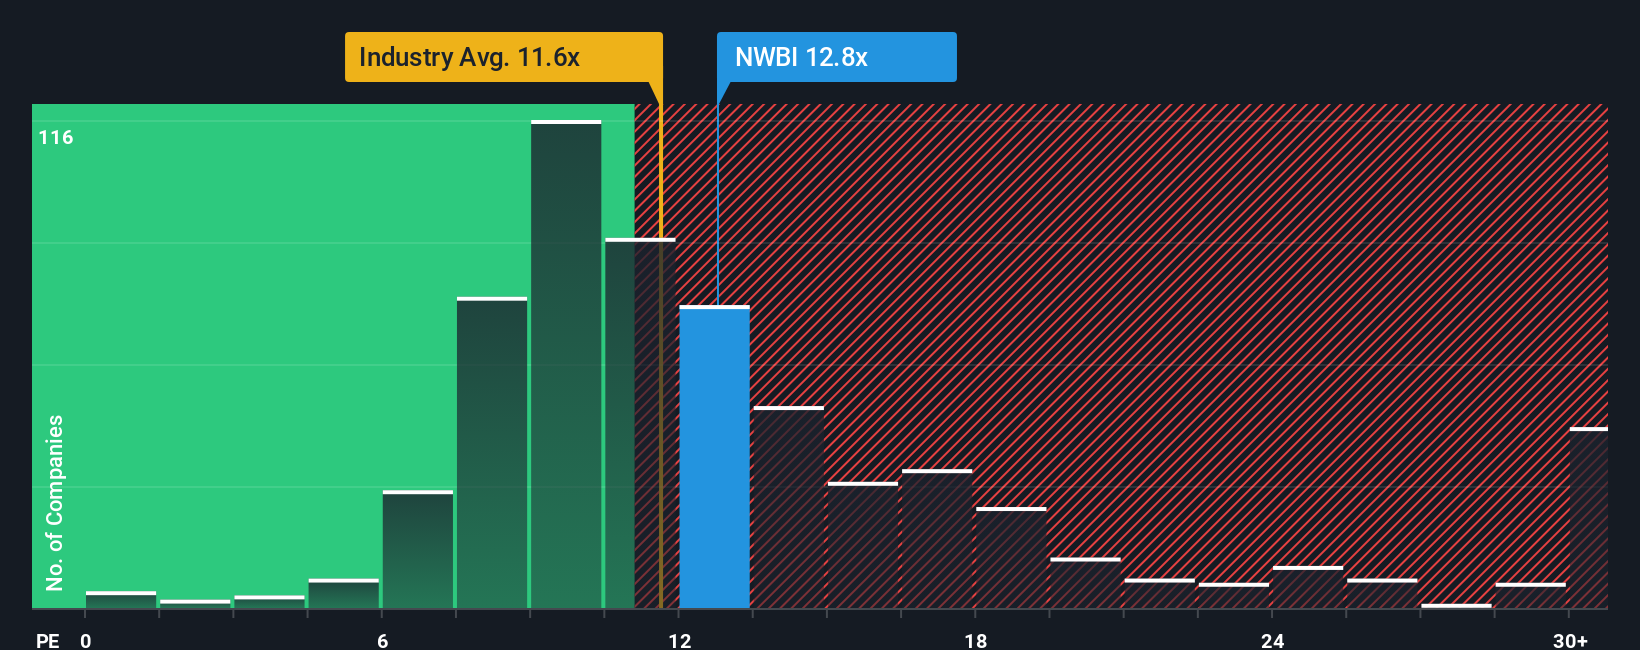
Northwest Bancshares currently trades on a PE of 16.48x, which is meaningfully above the broader Banks industry average of about 11.95x and also higher than the 12.00x average of its peers. To go a step further, Simply Wall St uses a Fair Ratio, in this case 15.85x, which reflects what the PE should be after adjusting for the company’s specific earnings growth outlook, profitability, risk profile, industry and size. This tailored yardstick is more informative than simple peer or industry comparisons because it incorporates fundamentals rather than just relative pricing. On that basis, Northwest Bancshares appears only modestly more expensive than its Fair Ratio, indicating that the market is asking for a small premium but not dramatically overpaying for the stock.
Result: OVERVALUED
PE ratios tell one story, but what if the real opportunity lies elsewhere? Discover 1448 companies where insiders are betting big on explosive growth.
Upgrade Your Decision Making: Choose your Northwest Bancshares Narrative
Earlier we mentioned that there is an even better way to understand valuation, so let us introduce you to Narratives, which are simply your own story about a company tied directly to the numbers you think are realistic for its future revenue, earnings and margins, and the fair value that falls out of those assumptions.
A Narrative connects how you see Northwest Bancshares business, such as integration of acquisitions, digital transformation and regional risks, to a concrete financial forecast and then to a specific fair value per share, making the link between story and spreadsheet completely transparent.
On Simply Wall St, used by millions of investors, Narratives live inside the Community page, where they are easy to set up, compare and track, and they automatically update when new information like earnings results or major news changes the outlook.
This means you can quickly see whether your Narrative fair value suggests Northwest Bancshares is attractively or unattractively priced at today’s level, and you can compare competing Narratives, for example one that sees fair value around $13 per share versus another closer to $22, to decide which story and set of assumptions you actually believe.
Do you think there's more to the story for Northwest Bancshares? Head over to our Community to see what others are saying!

This article by Simply Wall St is general in nature. We provide commentary based on historical data and analyst forecasts only using an unbiased methodology and our articles are not intended to be financial advice. It does not constitute a recommendation to buy or sell any stock, and does not take account of your objectives, or your financial situation. We aim to bring you long-term focused analysis driven by fundamental data. Note that our analysis may not factor in the latest price-sensitive company announcements or qualitative material. Simply Wall St has no position in any stocks mentioned.
Have feedback on this article? Concerned about the content? Get in touch with us directly. Alternatively, email editorial-team@simplywallst.com