
 Nasdaq
 華爾街日報
華爾街日報Does ZIM Integrated Shipping Services Still Offer Value After Its 142.4% Three Year Surge?
- If you have ever looked at ZIM Integrated Shipping Services and wondered whether the current share price really reflects its long term potential, you are not alone. This article is going to unpack that value question clearly.
- Despite being down 19.5% year to date and slipping 6.3% in the last week, the stock is still up 19.5% over the past month, 22.3% over 1 year and 142.4% over 3 years. This hints at shifting market expectations and risk perceptions.
- Recent moves in container shipping rates and changing trade lane dynamics have put the spotlight back on liner companies like ZIM Integrated Shipping Services. Investors are debating how sustainable the current pricing environment really is. At the same time, ongoing discussions about capacity additions, supply chain normalisation and geopolitical disruptions are shaping sentiment around how cyclical this upswing could be.
- On our checklist based valuation framework, ZIM Integrated Shipping Services currently scores a 4/6 valuation score, suggesting it screens undervalued on most but not all metrics. We will break this down using several valuation approaches before exploring an additional way to think about its worth at the end of the article.
Approach 1: ZIM Integrated Shipping Services Discounted Cash Flow (DCF) Analysis
A Discounted Cash Flow model estimates what a business is worth by projecting its future cash flows and discounting them back to today, so investors can compare that value with the current share price.
For ZIM Integrated Shipping Services, the model uses recent Free Cash Flow of about $2.89 billion and then applies a 2 Stage Free Cash Flow to Equity approach, with analyst estimates for the next few years and extrapolated values thereafter. By 2035, Simply Wall St projects annual Free Cash Flow of roughly $718 million, reflecting a gradual normalisation from the current cycle rather than aggressive growth.
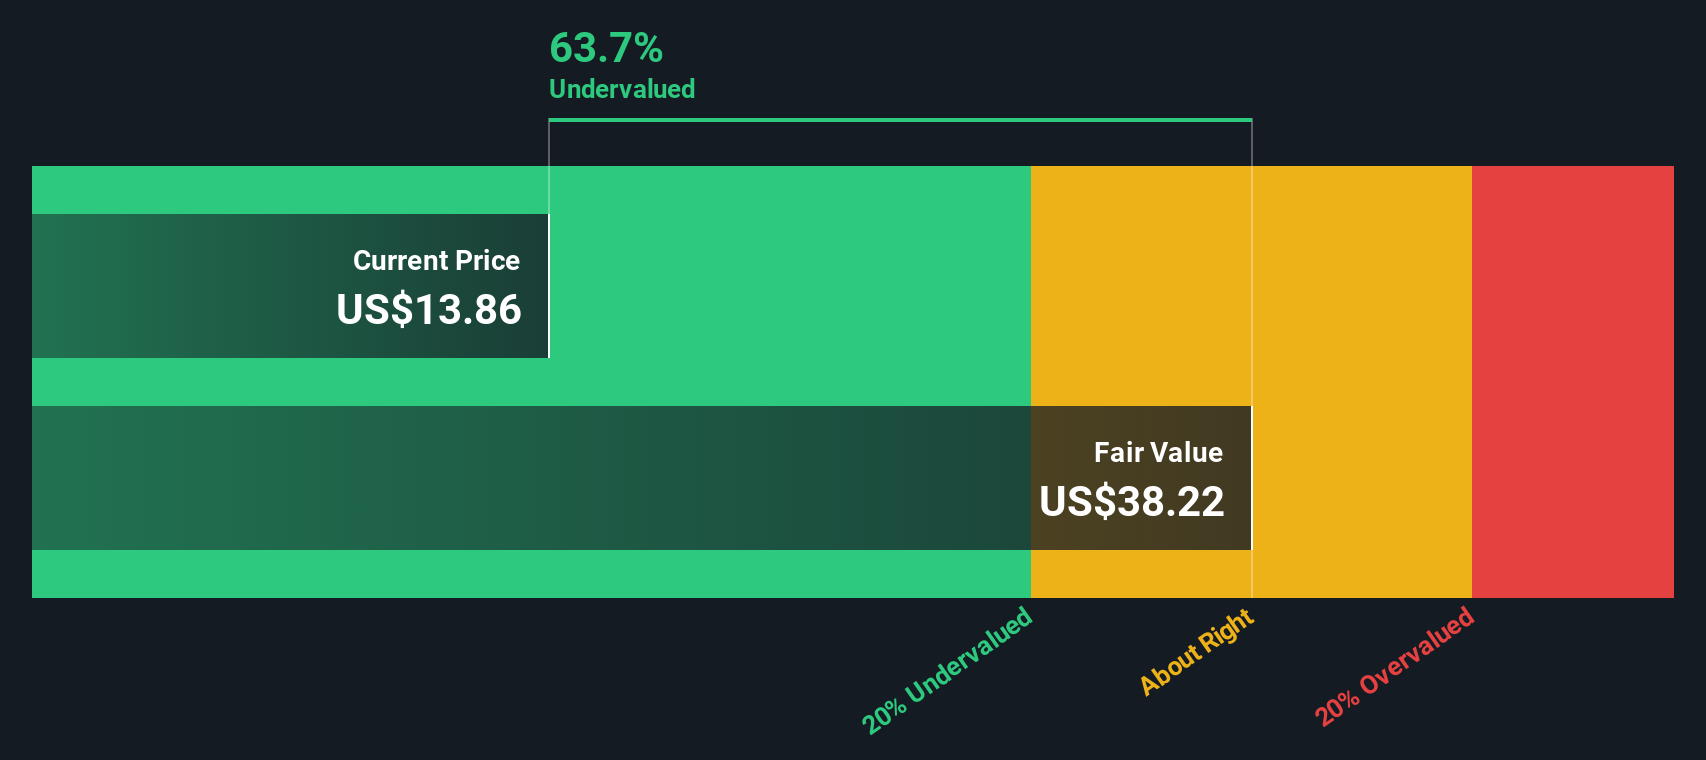
After discounting these projected cash flows back to today and adding a terminal value, the model arrives at an intrinsic value of about $43.25 per share. In this model, the DCF indicates the shares are trading at roughly a 56.6% discount to this estimate, so the stock currently screens as significantly undervalued on a cash flow basis.
Result: UNDERVALUED
Our Discounted Cash Flow (DCF) analysis suggests ZIM Integrated Shipping Services is undervalued by 56.6%. Track this in your watchlist or portfolio, or discover 907 more undervalued stocks based on cash flows.
Approach 2: ZIM Integrated Shipping Services Price vs Earnings
For profitable companies like ZIM Integrated Shipping Services, the Price to Earnings, or PE, ratio is a useful way to gauge how much investors are willing to pay today for each dollar of current earnings. In general, faster growth and lower perceived risk justify a higher PE, while slower or more cyclical earnings and higher risk tend to push a fair multiple lower.
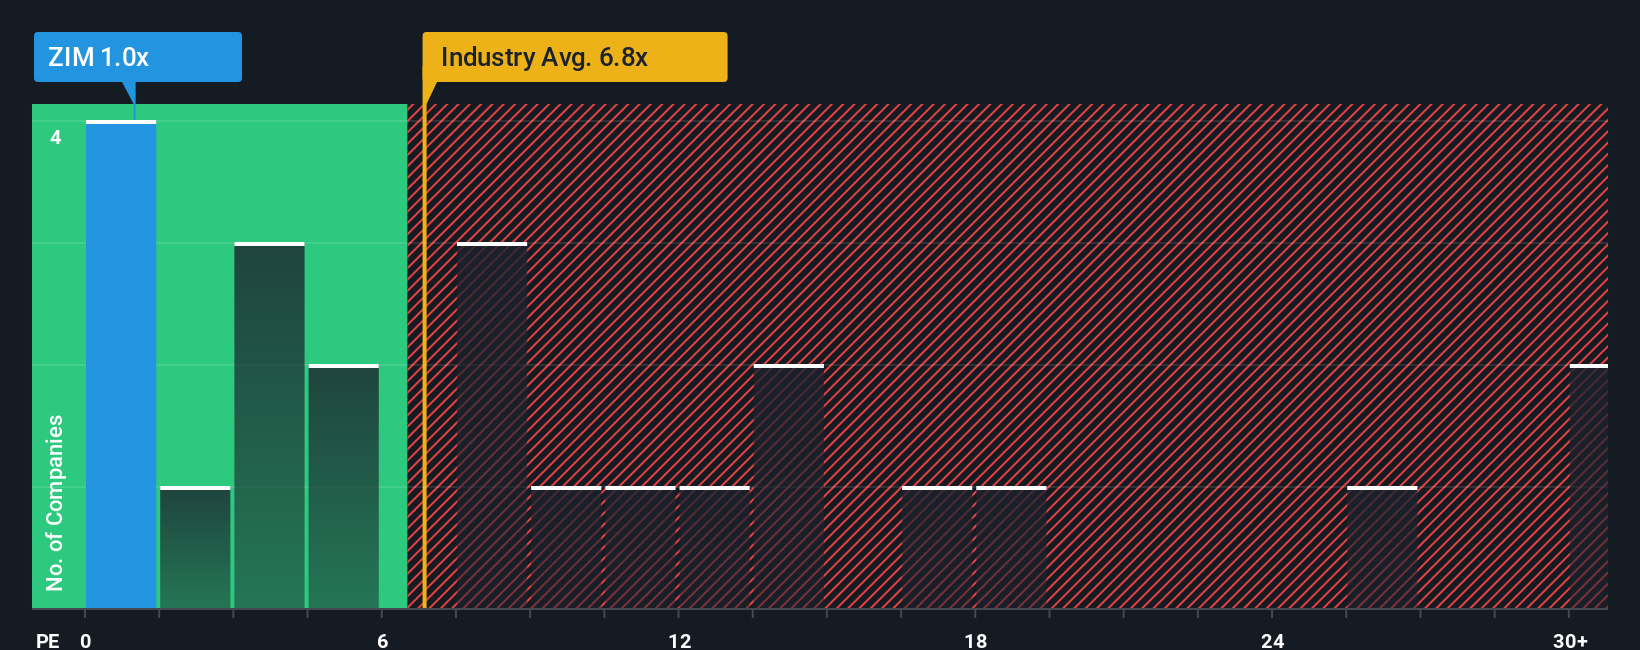
ZIM currently trades on a PE of about 2.25x, which is far below both the Shipping industry average of roughly 9.89x and the broader peer group average of around 12.97x. To refine this comparison, Simply Wall St uses a proprietary “Fair Ratio” of 0.80x for ZIM, which estimates the PE the company should trade at once you factor in its earnings growth profile, profit margins, industry characteristics, market cap and company specific risks.
This Fair Ratio provides a more tailored benchmark than a simple peer or industry comparison, because it adjusts for how risky and cyclical ZIM’s earnings may be relative to others. With the actual PE of 2.25x sitting well above the 0.80x Fair Ratio, the stock looks expensive on this metric despite its low headline multiple versus peers.
Result: OVERVALUED
PE ratios tell one story, but what if the real opportunity lies elsewhere? Discover 1448 companies where insiders are betting big on explosive growth.
Upgrade Your Decision Making: Choose your ZIM Integrated Shipping Services Narrative
Earlier we mentioned that there is an even better way to understand valuation, so let us introduce Narratives, an easy way for you to attach a clear story about a company to the numbers you think are fair for its future revenue, earnings and margins. You can then see how that story translates into a Fair Value you can compare with today’s price.
On Simply Wall St’s Community page, millions of investors use Narratives to connect what they believe is happening to a business with a structured financial forecast. This automatically produces a Fair Value that updates dynamically as new information such as earnings releases, news or guidance changes come in.
For ZIM Integrated Shipping Services, one investor might build a cautious Narrative that leans on weaker China U.S. trade flows, shrinking margins and a Fair Value close to about $9.80. Another might focus on fleet modernisation, route diversification and digital efficiency gains and arrive at a more optimistic Fair Value near $19.00. By comparing each Narrative’s Fair Value with the current share price, they can quickly decide whether ZIM looks like a buy, hold or sell to them.
Do you think there's more to the story for ZIM Integrated Shipping Services? Head over to our Community to see what others are saying!

This article by Simply Wall St is general in nature. We provide commentary based on historical data and analyst forecasts only using an unbiased methodology and our articles are not intended to be financial advice. It does not constitute a recommendation to buy or sell any stock, and does not take account of your objectives, or your financial situation. We aim to bring you long-term focused analysis driven by fundamental data. Note that our analysis may not factor in the latest price-sensitive company announcements or qualitative material. Simply Wall St has no position in any stocks mentioned.
Have feedback on this article? Concerned about the content? Get in touch with us directly. Alternatively, email editorial-team@simplywallst.com