
 Nasdaq
 華爾街日報
華爾街日報Is Ascentage Pharma Group International Pricing In Too Much Biotech Optimism After Big 3 Year Rally?
- If you are wondering whether Ascentage Pharma Group International is still a smart way to get exposure to biotech upside, you are not alone. That is exactly what we are going to unpack here.
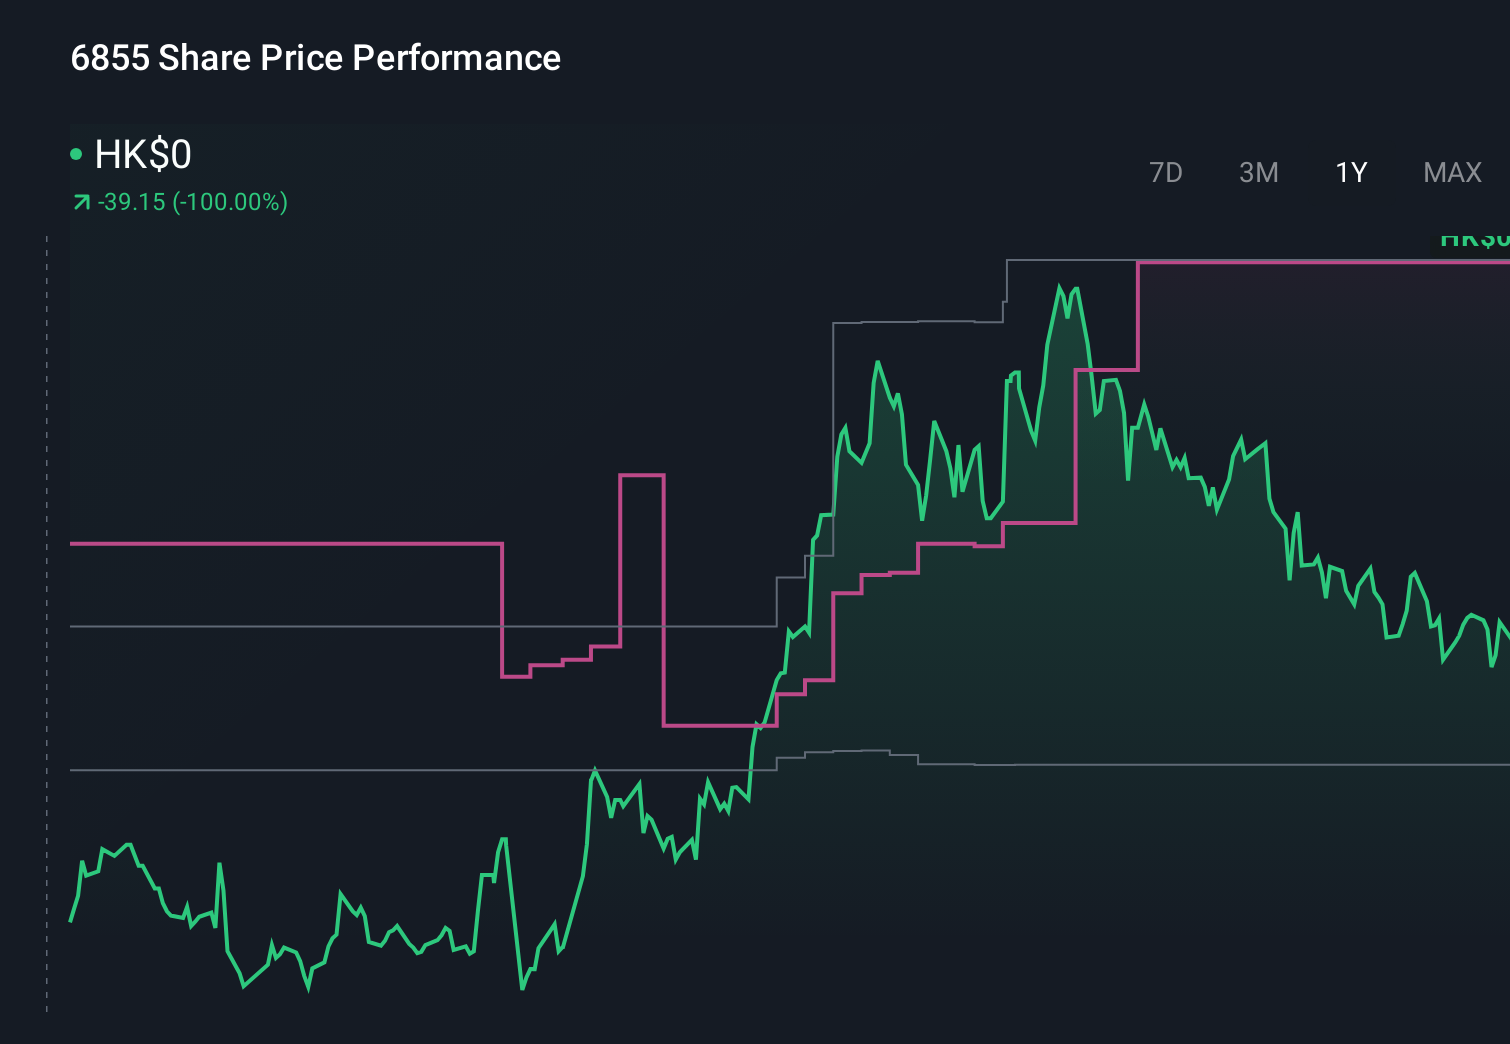
- Despite a choppy recent stretch, with the share price down 6.8% over the last week and 8.1% over the past month, the stock is still sitting on gains of 35.4% year to date and 53.1% over the last year, building on a 131.9% return over three years.
- Recent moves have been shaped less by day to day trading noise and more by how investors are reading the company’s progress in its clinical pipeline and partnerships. As biotech sentiment swings between optimism on new therapies and caution on funding conditions, Ascentage’s story has been pulled along for the ride. This gives extra weight to any pipeline or regulatory updates.
- On our basic valuation checks, Ascentage Pharma Group International currently scores just 0/6. We will walk through what traditional valuation tools say about that score, and then finish with a more nuanced way to think about what the market may really be pricing in.
Ascentage Pharma Group International scores just 0/6 on our valuation checks. See what other red flags we found in the full valuation breakdown.
Approach 1: Ascentage Pharma Group International Discounted Cash Flow (DCF) Analysis
A DCF model estimates what a company is worth by projecting its future cash flows and discounting them back into today’s CN¥ terms. For Ascentage Pharma Group International, the model used is a 2 Stage Free Cash Flow to Equity approach, based on cash flow projections that extend beyond analyst forecasts.
The company is currently generating negative free cash flow of about CN¥246.2 Million, reflecting the heavy investment phase typical for biotechs. Analyst and extrapolated projections expect this to swing into positive territory over time, rising to roughly CN¥615.2 Million by 2035, with a path that includes both setbacks and strong growth as key programs mature.
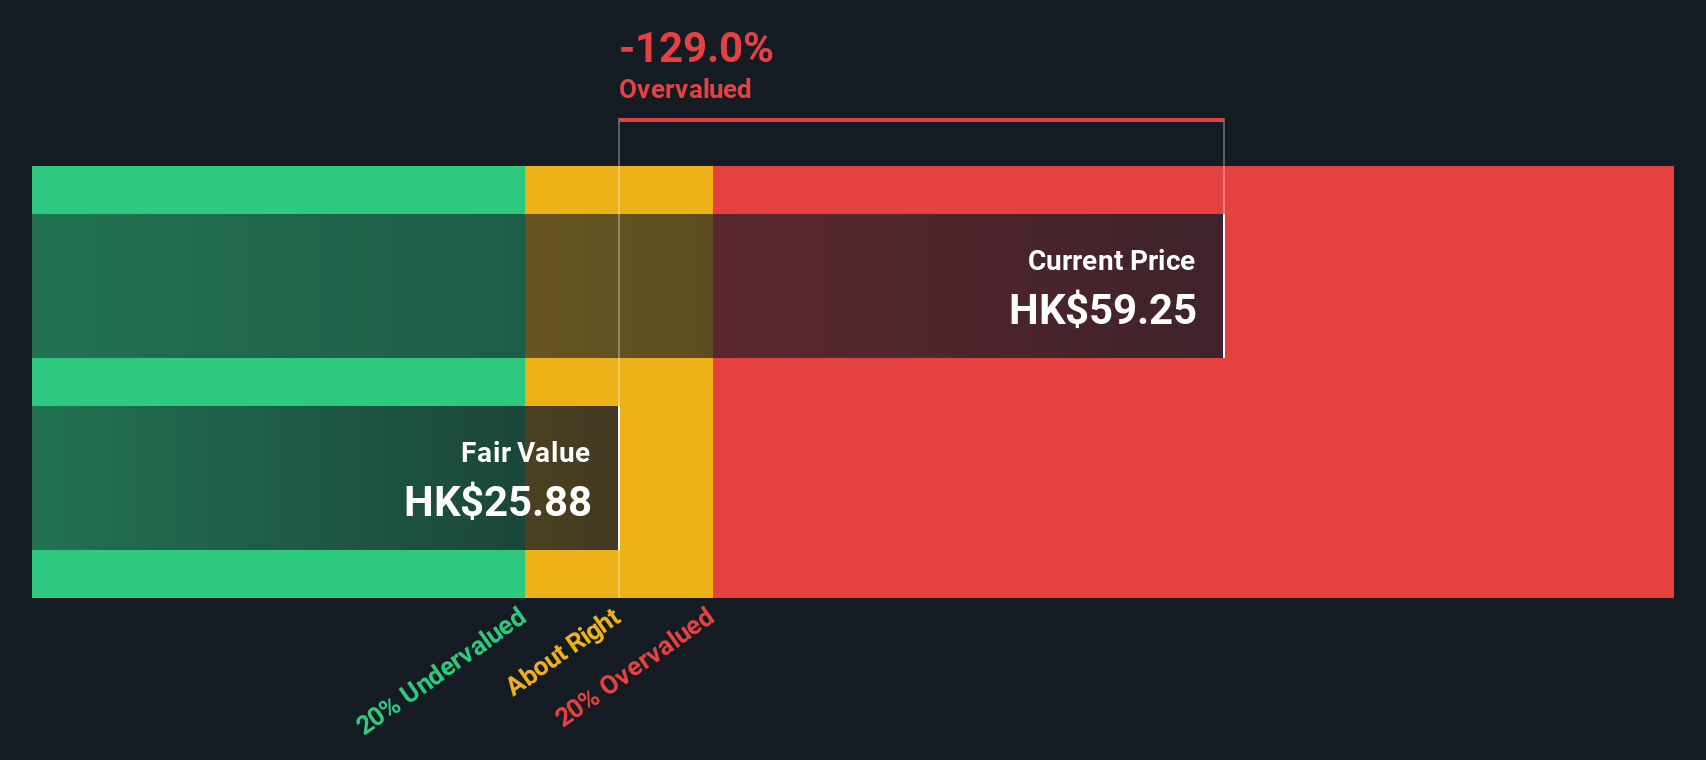
When all these projected cash flows are discounted back, the model arrives at an intrinsic value of HK$25.90 per share. This implies the stock is trading at roughly a 128.8% premium to its DCF value, which indicates that the market is already pricing in very optimistic outcomes from the pipeline.
Result: OVERVALUED
Our Discounted Cash Flow (DCF) analysis suggests Ascentage Pharma Group International may be overvalued by 128.8%. Discover 907 undervalued stocks or create your own screener to find better value opportunities.
Approach 2: Ascentage Pharma Group International Price vs Book
For companies that are not yet consistently profitable, price to book can be a more practical yardstick than earnings based multiples, because it compares what investors are paying to the accounting value of the assets that support future growth.
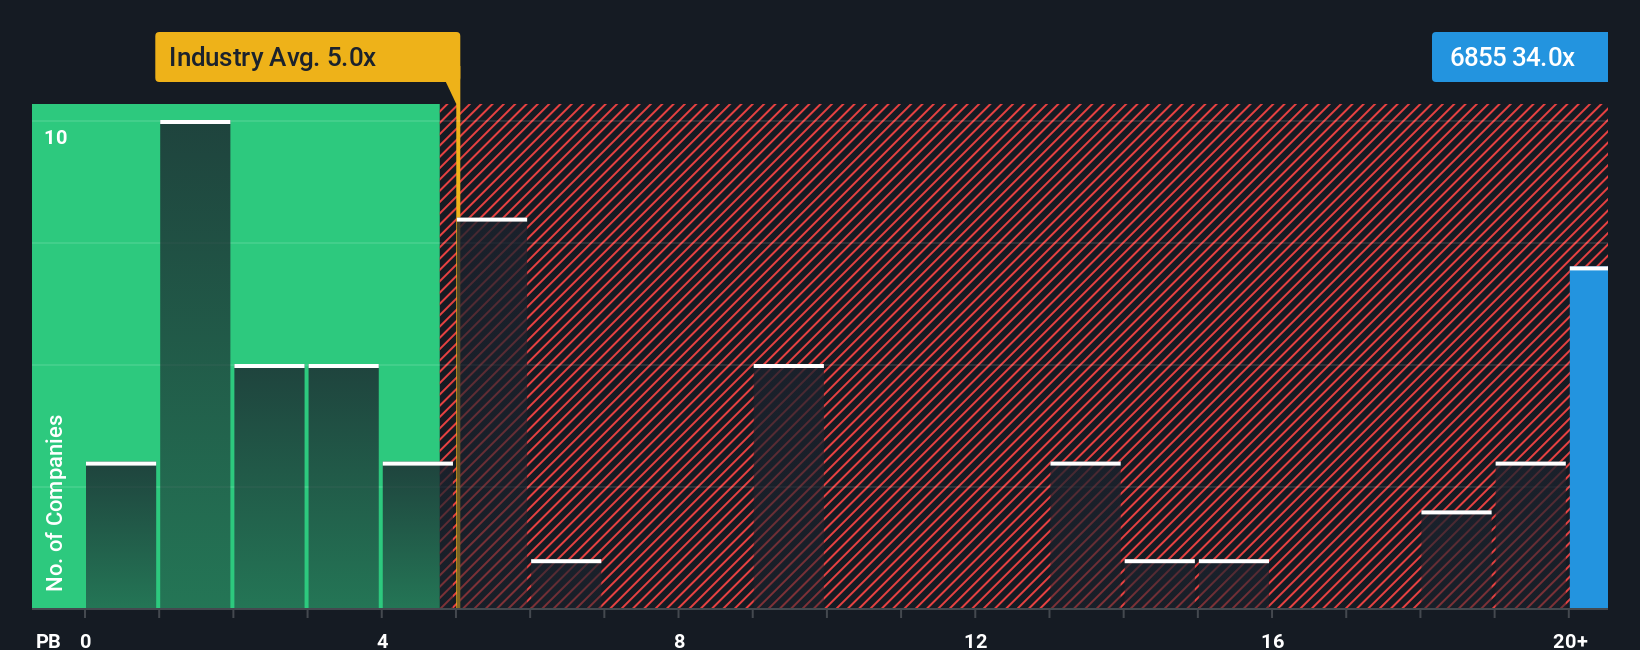
In general, faster growth prospects and lower perceived risk justify paying a higher price to book ratio. Slower growth or higher risk usually call for a more modest multiple. Against that backdrop, Ascentage Pharma Group International currently trades at about 29.7x book value, far richer than the Biotechs industry average of around 4.7x and above its peer group average of roughly 5.6x.
Simply Wall St’s Fair Ratio framework goes a step further by estimating the price to book multiple that would be reasonable for Ascentage, given its specific blend of growth potential, profitability trajectory, risk profile, market cap and biotech industry dynamics. Because this Fair Ratio is tailored to the company rather than relying on broad peer or sector comparisons, it offers a sharper view of whether investors are overpaying for its story. With Ascentage’s actual 29.7x multiple sitting well above this model implied Fair Ratio, the shares look stretched on a book value basis.
Result: OVERVALUED
PB ratios tell one story, but what if the real opportunity lies elsewhere? Discover 1448 companies where insiders are betting big on explosive growth.
Upgrade Your Decision Making: Choose your Ascentage Pharma Group International Narrative
Earlier we mentioned that there is an even better way to understand valuation, so let us introduce you to Narratives, which are simply your own story about a company that connects what it does in the real world to a set of numbers such as future revenue, earnings, margins, and, ultimately, what you believe is a fair value for the shares.
A Narrative on Simply Wall St links your view of Ascentage Pharma Group International’s pipeline, partnerships, and risks to a financial forecast, then translates that forecast into a Fair Value that you can easily compare to today’s share price to decide if it is a buy, hold, or sell.
These Narratives live in the Community page on Simply Wall St, are used by millions of investors, and update dynamically as fresh information like news, trial data, or earnings is released, so your fair value view evolves as the story does.
For example, one Ascentage Narrative may assume the bullish HK$92.99 fair value based on strong uptake of Olverembatinib and Lisaftoclax, while another more cautious Narrative uses the HK$51.97 fair value, reflecting concerns about reliance on a few assets and execution risks when scaling globally.
Do you think there's more to the story for Ascentage Pharma Group International? Head over to our Community to see what others are saying!
This article by Simply Wall St is general in nature. We provide commentary based on historical data and analyst forecasts only using an unbiased methodology and our articles are not intended to be financial advice. It does not constitute a recommendation to buy or sell any stock, and does not take account of your objectives, or your financial situation. We aim to bring you long-term focused analysis driven by fundamental data. Note that our analysis may not factor in the latest price-sensitive company announcements or qualitative material. Simply Wall St has no position in any stocks mentioned.
Have feedback on this article? Concerned about the content? Get in touch with us directly. Alternatively, email editorial-team@simplywallst.com