
 Nasdaq
 華爾街日報
華爾街日報Has Turning Point Brands Rallies in 2025 Already Priced In Future Growth?
- If you are wondering whether Turning Point Brands is still a smart buy after its big run up, you are not alone. This article is going to unpack exactly what the current price might be baking in.
- The stock has climbed 6.0% over the last week, 4.1% over the last month, and is now up an eye catching 72.5% year to date, with a massive 430.9% gain over three years and 151.2% over five years that has clearly changed how the market views its prospects.
- Recent attention around Turning Point Brands has focused on its positioning within alternative nicotine and next generation products, as investors weigh how regulatory shifts and consumer trends could influence long term demand. At the same time, commentary around the wider tobacco and vaping space has highlighted how niche brands like TPB can sometimes grow faster than the majors, but also carry more volatility and regulatory risk.
- Despite that backdrop, Simply Wall St currently gives Turning Point Brands a valuation score of 0/6, which means it does not screen as undervalued on any of the six standard checks. Next we will walk through those valuation approaches in more detail, and later explore a more nuanced way to think about what TPB might really be worth.
Turning Point Brands scores just 0/6 on our valuation checks. See what other red flags we found in the full valuation breakdown.
Approach 1: Turning Point Brands Discounted Cash Flow (DCF) Analysis
A Discounted Cash Flow model estimates what a company is worth by projecting its future cash flows and then discounting those back to today to reflect risk and the time value of money. For Turning Point Brands, the model used is a 2 Stage Free Cash Flow to Equity approach based on cash flow projections.
The company generated around $42 Million of free cash flow over the last twelve months, and analysts expect this to climb to about $73.75 Million by 2026. Beyond the formal analyst horizon, Simply Wall St extrapolates further and implies free cash flow could rise to roughly $99.5 Million by 2035, with growth gradually slowing over time.
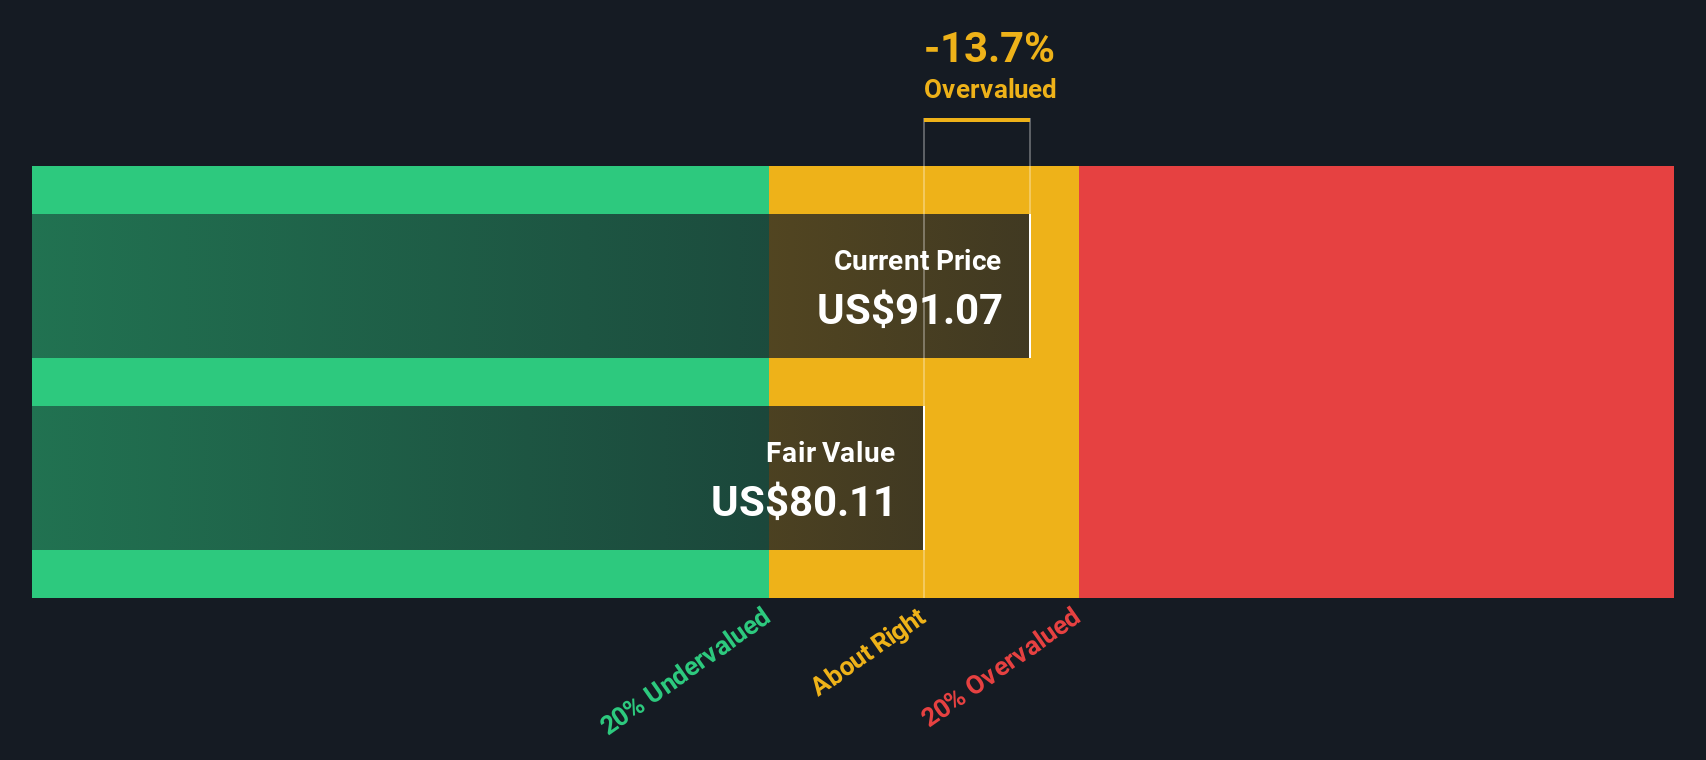
When all these projected cash flows are discounted back to today, the model suggests an intrinsic value of about $87.52 per share. Compared with the current share price, this implies the stock is roughly 19.6% overvalued on a DCF basis, meaning the market is already pricing in very robust cash flow growth.
Result: OVERVALUED
Our Discounted Cash Flow (DCF) analysis suggests Turning Point Brands may be overvalued by 19.6%. Discover 904 undervalued stocks or create your own screener to find better value opportunities.
Approach 2: Turning Point Brands Price vs Earnings
For a consistently profitable company like Turning Point Brands, the price to earnings ratio is a useful way to gauge how much investors are willing to pay today for each dollar of current earnings. In general, stronger and more reliable earnings growth can justify a higher PE. Slower growth, higher risk, or more cyclical earnings usually warrant a lower, more conservative multiple.
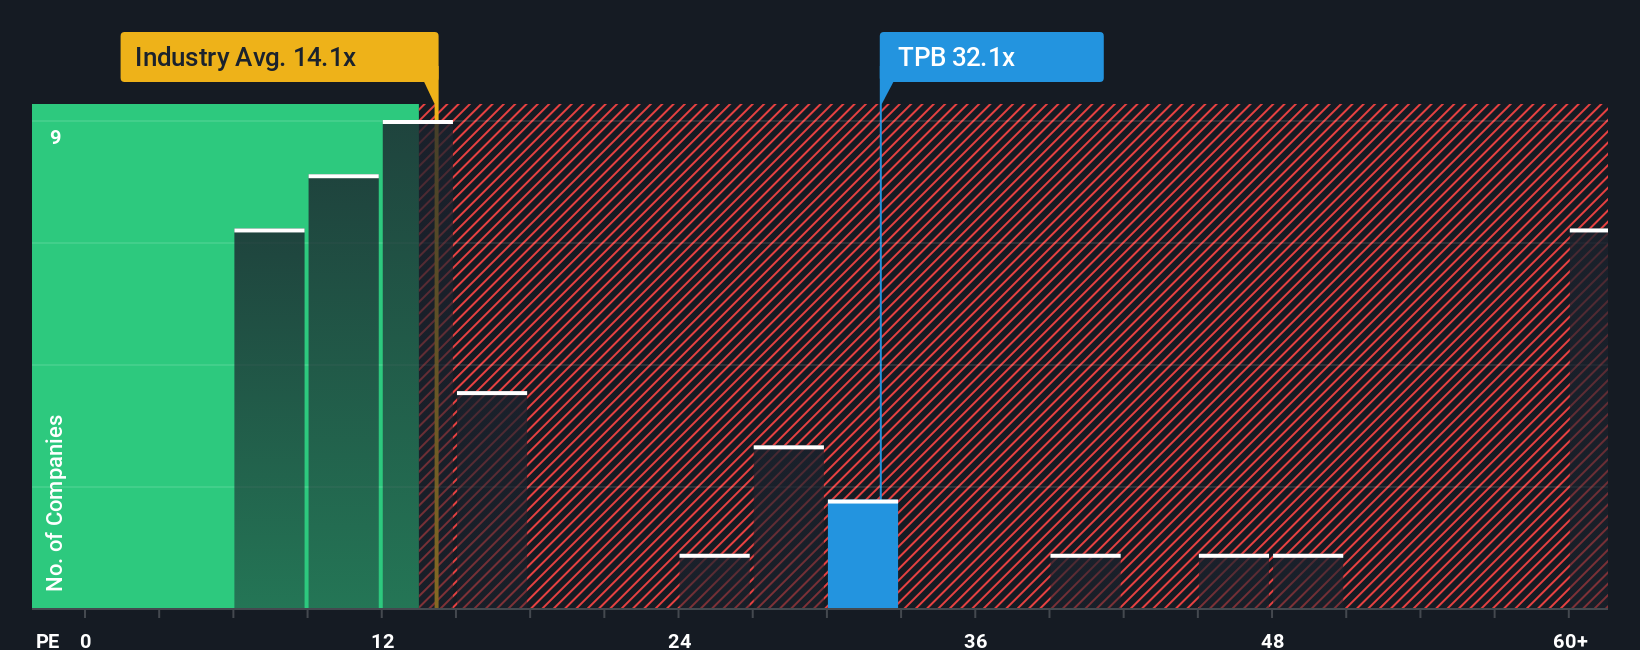
Turning Point Brands currently trades on a PE of about 33.4x, which is well above both the Tobacco industry average of roughly 13.1x and the broader peer group at around 28.3x. To move beyond these blunt comparisons, Simply Wall St uses a proprietary Fair Ratio, which estimates what a reasonable PE should be after accounting for the company’s specific earnings growth outlook, risk profile, profitability, industry positioning and market capitalization. This tailored Fair Ratio, currently 25.3x for TPB, is more informative than simple peer or industry averages because it incorporates the company’s own strengths and vulnerabilities rather than assuming it should trade like a typical tobacco stock.
Comparing the Fair Ratio of 25.3x with the actual PE of 33.4x suggests the shares are pricing in more optimism than the fundamentals justify.
Result: OVERVALUED
PE ratios tell one story, but what if the real opportunity lies elsewhere? Discover 1447 companies where insiders are betting big on explosive growth.
Upgrade Your Decision Making: Choose your Turning Point Brands Narrative
Earlier we mentioned that there is an even better way to understand valuation, so let us introduce you to Narratives. This is a simple way to connect your view of Turning Point Brands business with a set of numbers for future revenue, earnings, margins and ultimately fair value.
A Narrative is your story behind the numbers. It captures what you believe about TPB’s growth drivers, risks and competitive edge, then translates that story into a concrete forecast and a Fair Value estimate you can compare directly with today’s share price.
On Simply Wall St, Narratives live in the Community page and are used by millions of investors. They give you an accessible tool that makes it easier to decide whether to buy, hold or sell by showing at a glance if your Fair Value is above or below the current price and by how much.
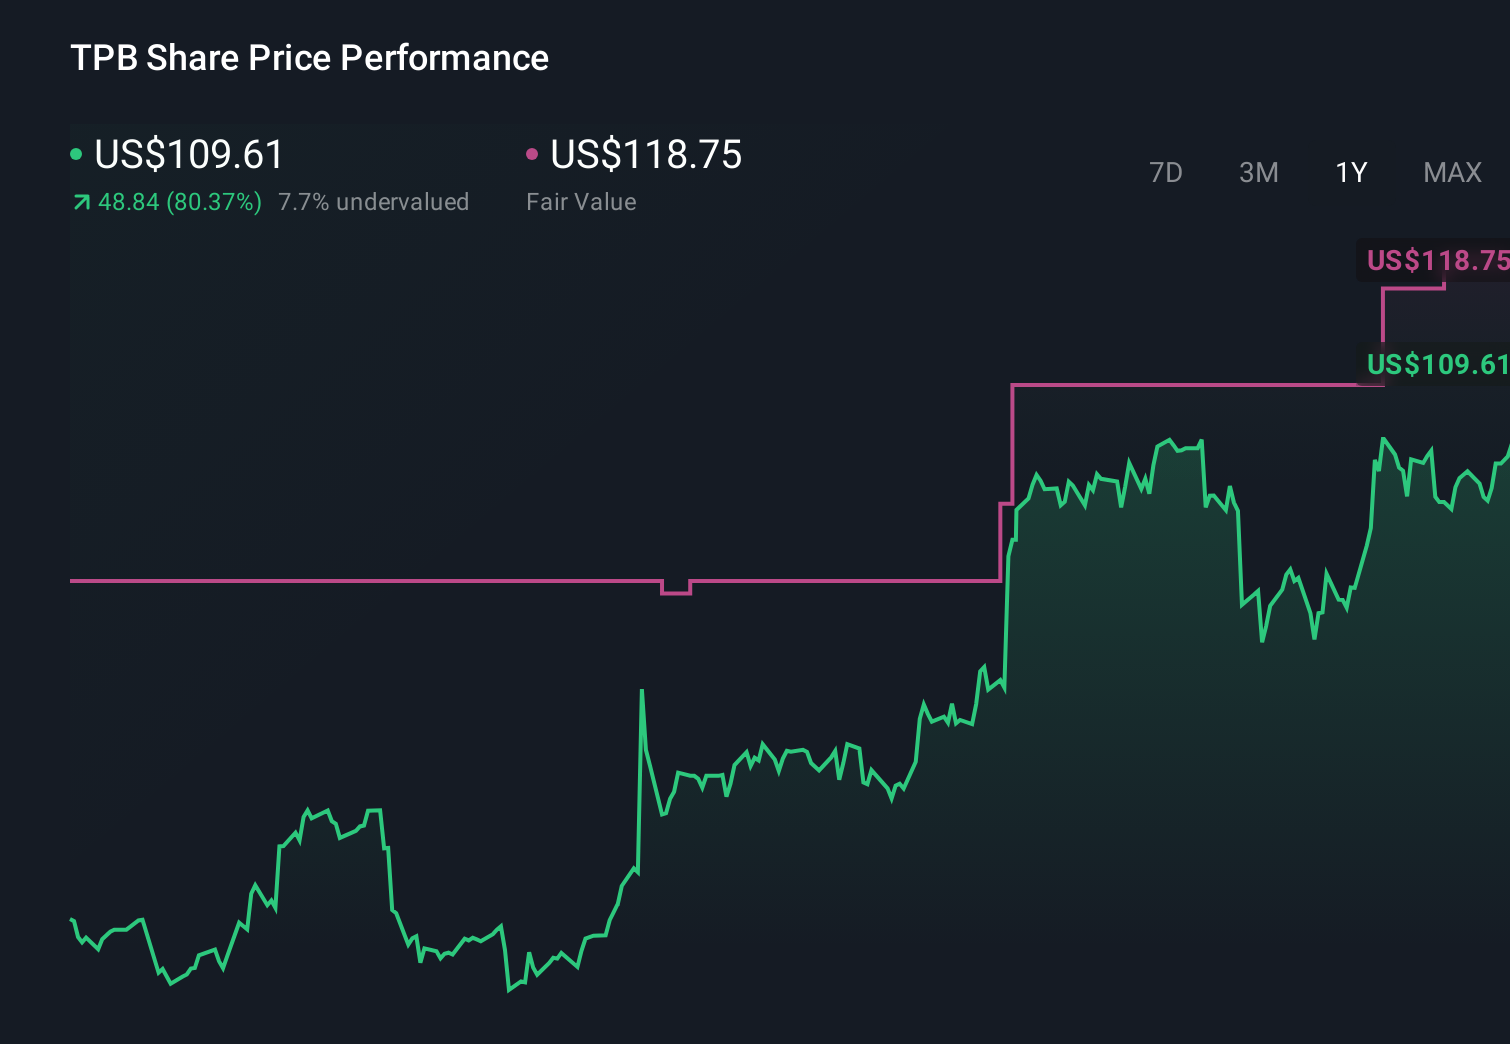
Because Narratives update dynamically as new earnings, news and guidance arrive, a bullish investor might justify a Fair Value of around $118.75 based on strong nicotine pouch growth. A more cautious investor, focusing on regulatory and competitive risks, might anchor their Narrative closer to the current price. Both perspectives can evolve as fresh information comes in.
Do you think there's more to the story for Turning Point Brands? Head over to our Community to see what others are saying!
This article by Simply Wall St is general in nature. We provide commentary based on historical data and analyst forecasts only using an unbiased methodology and our articles are not intended to be financial advice. It does not constitute a recommendation to buy or sell any stock, and does not take account of your objectives, or your financial situation. We aim to bring you long-term focused analysis driven by fundamental data. Note that our analysis may not factor in the latest price-sensitive company announcements or qualitative material. Simply Wall St has no position in any stocks mentioned.
Have feedback on this article? Concerned about the content? Get in touch with us directly. Alternatively, email editorial-team@simplywallst.com