
 Nasdaq
 華爾街日報
華爾街日報Is Venture Global’s 74% Slide in 2025 Creating an Opportunity for Investors?
- If you are wondering whether Venture Global at around $6 a share is a bargain in disguise or a value trap, you are not alone. This breakdown is designed to help you cut through the noise.
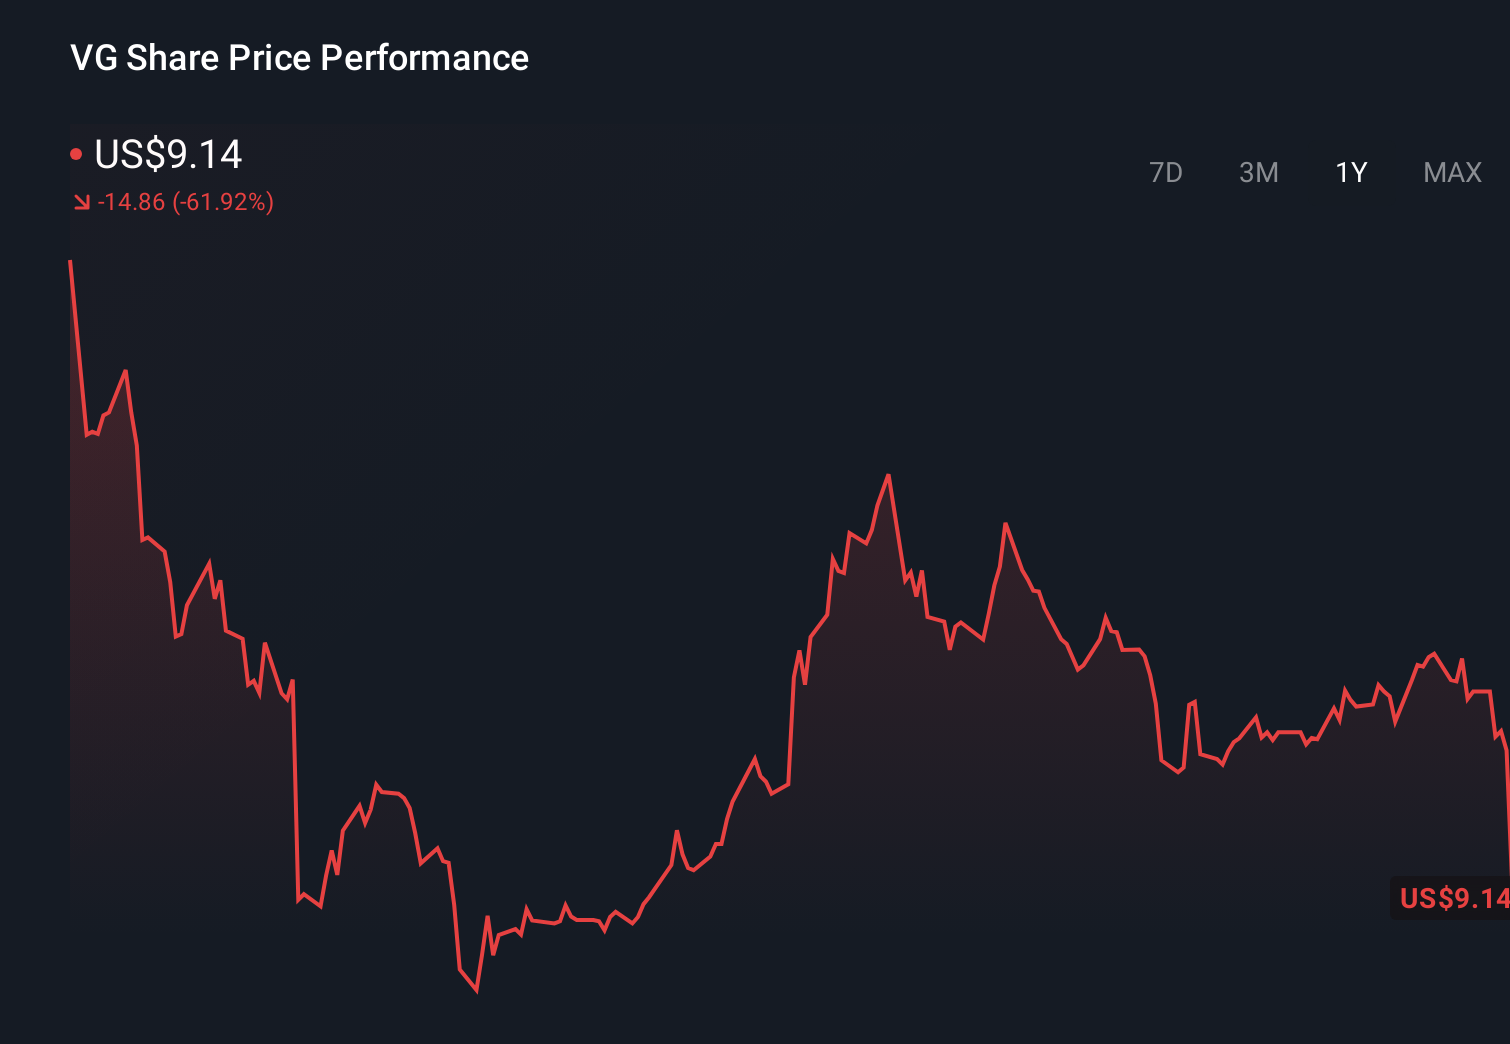
- The stock has slid sharply, down about 11.1% over the last week, 17.1% over the past month, and 74.0% year to date. This has many investors reassessing both its upside potential and risk profile.
- Recent headlines around Venture Global have focused on project execution milestones, regulatory developments, and shifting sentiment toward liquefied natural gas exporters. These factors help explain the volatility you are seeing in the share price. Together, these news items have raised fresh questions about how sustainable the current business model is and whether the market is overreacting or simply catching up to reality.
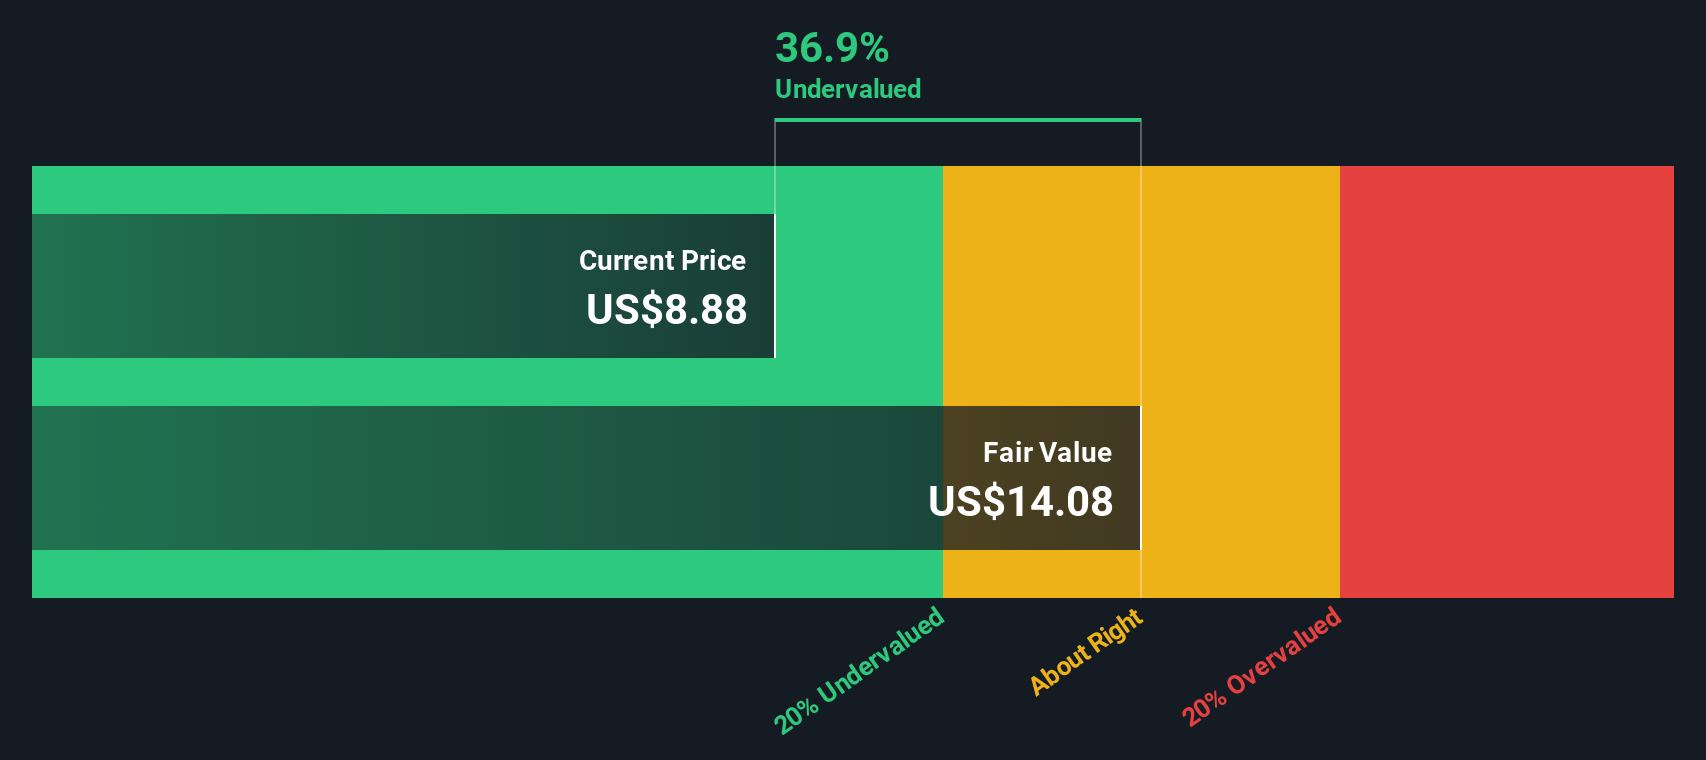
- On our valuation framework, Venture Global currently scores 3/6 on undervaluation checks, as shown in its valuation score. This suggests there are pockets of value but also areas where the market may be cautious. In the sections that follow, we will walk through the main valuation approaches investors are using, and then finish with a more holistic way of thinking about what this price implies for the company’s future.
Approach 1: Venture Global Discounted Cash Flow (DCF) Analysis
A Discounted Cash Flow model estimates what a company is worth by projecting its future cash flows and then discounting them back to today using a required rate of return.
For Venture Global, the latest twelve month free cash flow is deeply negative at about $10.7 billion, reflecting heavy investment and cash burn rather than cash generation. Analysts see cash flows remaining negative for several years, with projections such as around $5.9 billion and $8.2 billion of negative free cash flow in 2026 and 2027 respectively, before improving. By 2035, Simply Wall St’s extrapolated estimates point to free cash flow of roughly $2.4 billion, highlighting a long ramp up before the business is expected to consistently generate cash.
Aggregating and discounting these projected cash flows using a 2 Stage Free Cash Flow to Equity model yields an intrinsic value estimate of about $2.20 per share. Compared with the current share price near $6, the DCF implies the stock is roughly 183.7% overvalued, which suggests that today’s market price embeds very optimistic assumptions.
Result: OVERVALUED
Our Discounted Cash Flow (DCF) analysis suggests Venture Global may be overvalued by 183.7%. Discover 904 undervalued stocks or create your own screener to find better value opportunities.
Approach 2: Venture Global Price vs Earnings
For companies that are generating earnings, the Price to Earnings (PE) ratio is often the go to valuation tool because it directly connects what investors are paying with the profits the business is producing today. A higher PE can be justified when investors expect stronger growth or see the earnings stream as relatively low risk, while slower growth or higher uncertainty usually warrants a lower, more conservative multiple.
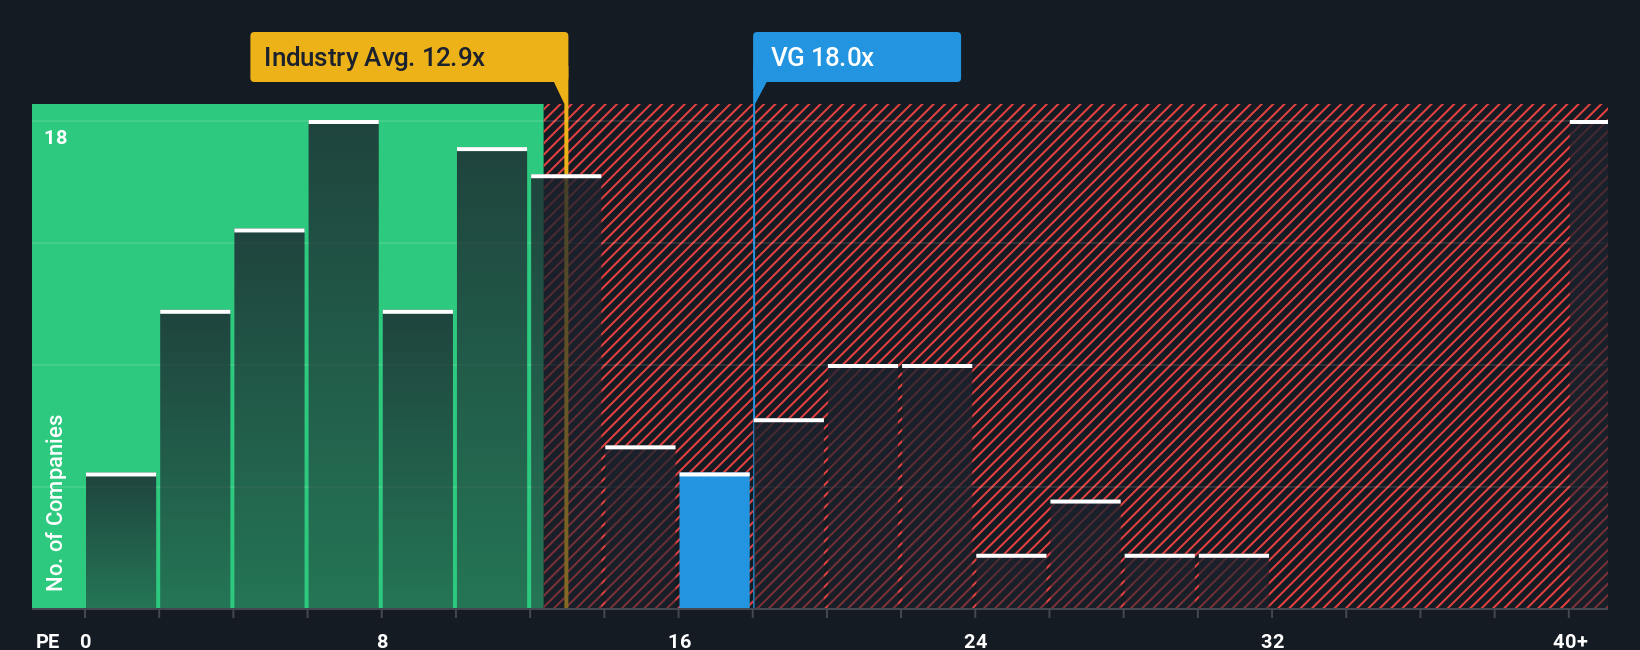
Venture Global currently trades on a PE of about 7.4x, which sits well below both the Oil and Gas industry average of roughly 13.5x and the broader peer group average near 23.0x. On the surface, that discount might suggest the market is skeptical about the durability or growth of its earnings compared with rivals.
Simply Wall St’s Fair Ratio framework refines this comparison by estimating what PE multiple Venture Global should command, given its specific earnings growth profile, margins, risks, industry position, and market cap. For Venture Global, the Fair Ratio is around 12.3x, notably higher than the current 7.4x. This suggests the shares may be trading below what might be implied by its earnings, even after adjusting for company specific risks and fundamentals.
Result: UNDERVALUED
PE ratios tell one story, but what if the real opportunity lies elsewhere? Discover 1446 companies where insiders are betting big on explosive growth.
Upgrade Your Decision Making: Choose your Venture Global Narrative
Earlier we mentioned that there is an even better way to understand valuation, so let us introduce you to Narratives, a simple framework that connects the story you believe about a company with the numbers behind its future. A Narrative on Simply Wall St is your own, clearly defined view of Venture Global’s future revenue, earnings, and margins, tied to an assumed fair value per share. Instead of treating valuation as a static number, Narratives link your investment thesis to a financial forecast and then to a fair value, so you can quickly see whether the current price suggests a buy, hold, or sell. Narratives live inside the Community page on Simply Wall St, where millions of investors share and compare their views using an easy to use interface. They also update dynamically as new information such as news, guidance, or earnings is released, helping your thesis stay current. For example, one Venture Global Narrative might assume rapid LNG demand growth and a much higher fair value, while another prices in execution delays and a substantially lower fair value, reflecting how different investors interpret the same company.
Do you think there's more to the story for Venture Global? Head over to our Community to see what others are saying!
This article by Simply Wall St is general in nature. We provide commentary based on historical data and analyst forecasts only using an unbiased methodology and our articles are not intended to be financial advice. It does not constitute a recommendation to buy or sell any stock, and does not take account of your objectives, or your financial situation. We aim to bring you long-term focused analysis driven by fundamental data. Note that our analysis may not factor in the latest price-sensitive company announcements or qualitative material. Simply Wall St has no position in any stocks mentioned.
Have feedback on this article? Concerned about the content? Get in touch with us directly. Alternatively, email editorial-team@simplywallst.com