
 Nasdaq
 華爾街日報
華爾街日報Does Southern’s Recent Pullback Create a Long Term Opportunity for Investors in 2025?
- Wondering if Southern is still a sensible buy at today’s price, or if the market has finally run ahead of itself? Let’s unpack what the numbers are really saying about its value.
- Despite a solid multi year run, with the share price up roughly 34.3% over 3 years and 67.6% over 5 years, the stock has cooled more recently, slipping about 3.0% over the last week and 7.0% over the past month while still sitting 5.0% higher than a year ago.
- Recent market attention has centered on Southern’s major capital projects, regulatory decisions across its service territories, and ongoing progress on grid reliability and clean energy investments. All of these factors influence how investors price its long term cash flows. These themes help explain why sentiment has been slightly more cautious in the short term, even as the long term story remains very much in play.
- On our valuation framework, Southern scores a 4/6 for being undervalued across six key checks, suggesting pockets of opportunity alongside some areas where the market might be closer to fair. Next, we will walk through those valuation methods in detail and then finish with a more intuitive way to tie them together into a clearer view of what the stock might really be worth.
Find out why Southern's 5.0% return over the last year is lagging behind its peers.
Approach 1: Southern Discounted Cash Flow (DCF) Analysis
A Discounted Cash Flow model estimates what a company is worth by projecting its future cash flows and then discounting them back to today’s dollars. For Southern, the model used is a 2 Stage Free Cash Flow to Equity approach, based on cash flow projections in $.
Southern’s latest twelve month free cash flow is negative at about $1.0 billion, reflecting heavy investment. However, analyst and extrapolated projections in the model indicate this could move into positive territory, reaching roughly $2.1 billion by 2027 and increasing toward about $19.5 billion by 2035 as major projects move from build phase to cash generation phase.
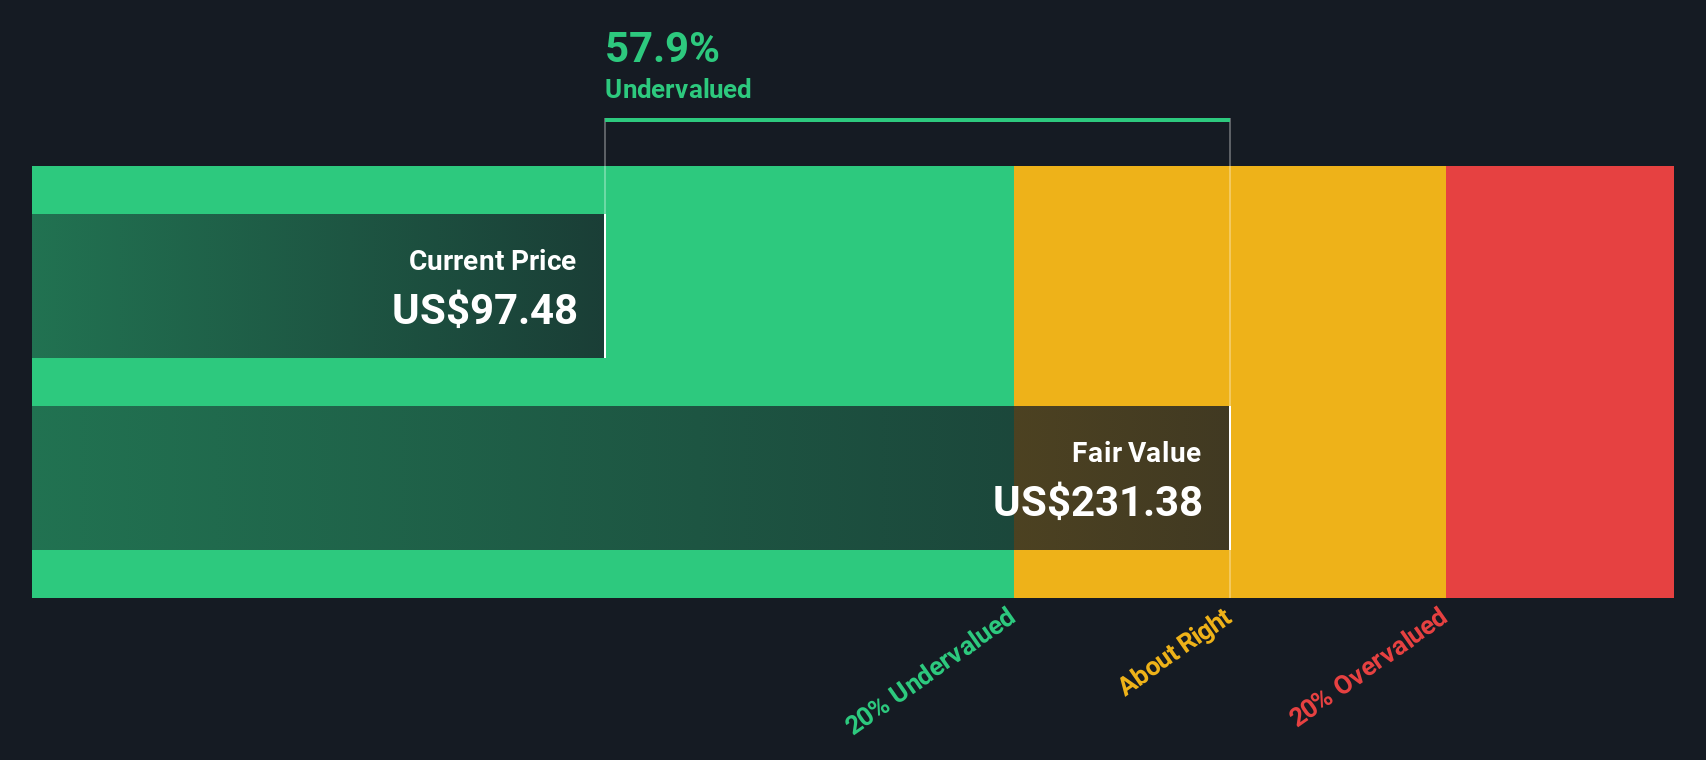
When these projected cash flows are discounted back to today, the model arrives at an estimated intrinsic value of about $287 per share. Compared with the current share price, this indicates the stock is approximately 70.5% undervalued within the assumptions of this DCF framework.
Result: UNDERVALUED (on this DCF basis)
Our Discounted Cash Flow (DCF) analysis suggests Southern is undervalued by 70.5%. Track this in your watchlist or portfolio, or discover 904 more undervalued stocks based on cash flows.
Approach 2: Southern Price vs Earnings
Price to earnings is a handy way to value a profitable utility like Southern because it directly links what investors pay today to the company’s current earnings power. In general, faster growth and lower perceived risk justify a higher PE ratio, while slower growth or higher risk warrant a lower one.
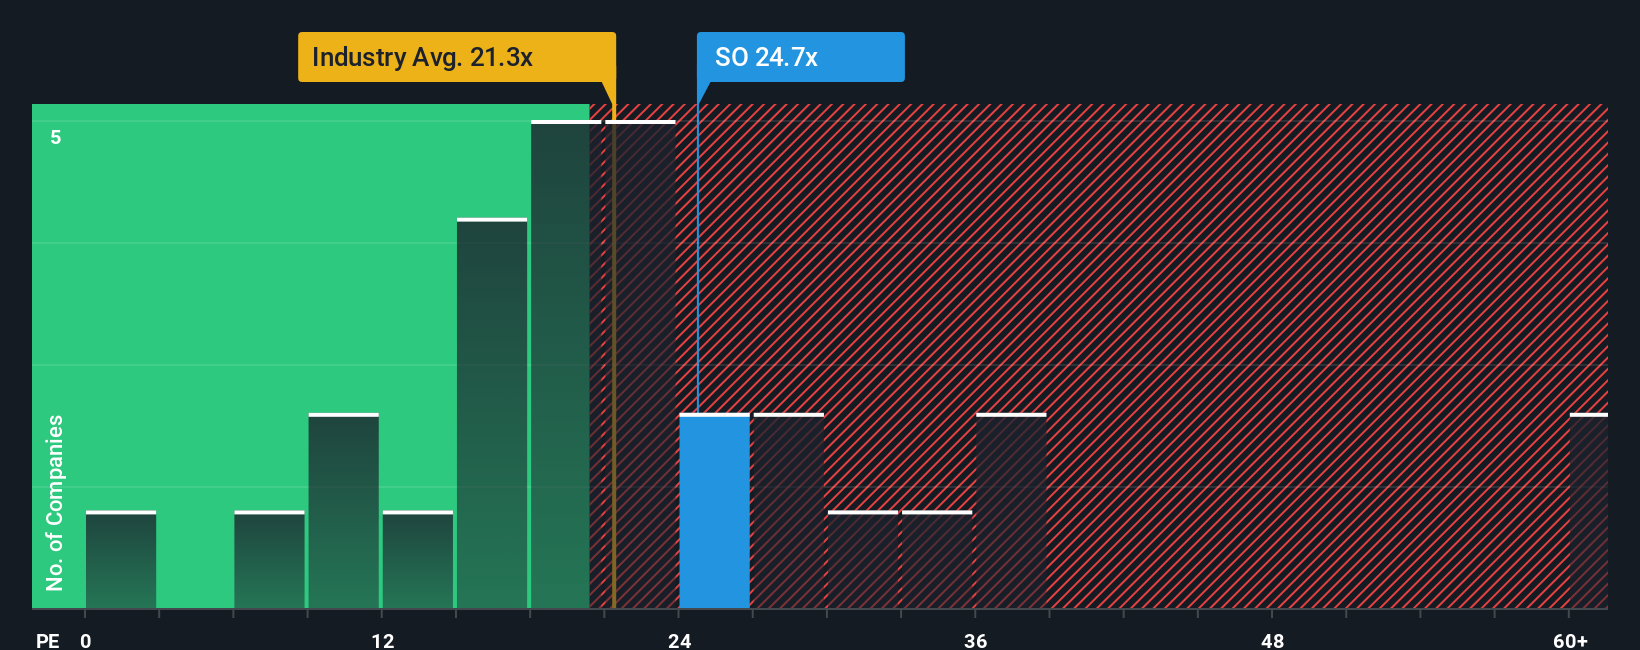
Southern currently trades on about 20.92x earnings, which is a premium to the Electric Utilities industry average of roughly 19.88x, but at a discount to the peer group average near 25.98x. To go a step further, Simply Wall St’s Fair Ratio is a proprietary PE estimate that reflects Southern’s specific earnings growth outlook, risk profile, profit margins, industry positioning and market cap. This makes it more tailored than a simple comparison to broad industry or peer averages, which can be skewed by very different business mixes or balance sheets.
For Southern, the Fair Ratio is calculated at around 24.93x, modestly above the current 20.92x multiple. Under this framework, this indicates the shares trade at a discount to what might be warranted by its fundamentals.
Result: UNDERVALUED
PE ratios tell one story, but what if the real opportunity lies elsewhere? Discover 1446 companies where insiders are betting big on explosive growth.
Upgrade Your Decision Making: Choose your Southern Narrative
Earlier we mentioned that there is an even better way to understand valuation, so let us introduce you to Narratives, a simple tool on Simply Wall St’s Community page where you connect a company’s story to a financial forecast and then to a fair value. A Narrative is your own view of Southern, turning what you believe about demand growth, regulation and capital spending into concrete expectations for future revenue, earnings and margins, and then into an estimated fair value that you can compare with today’s price to decide whether to buy, hold or sell. Because Narratives on the platform are updated dynamically when new information arrives, such as news about Southern’s composite equity units or fresh earnings guidance, your story and valuation can evolve as the facts change. For example, one investor might build a bullish Southern Narrative that justifies a fair value near the top analyst target of about $108 per share, while a more cautious investor could construct a bearish Narrative that supports a value closer to the low end near $75, and the platform helps you see exactly which assumptions create that gap.
Do you think there's more to the story for Southern? Head over to our Community to see what others are saying!
This article by Simply Wall St is general in nature. We provide commentary based on historical data and analyst forecasts only using an unbiased methodology and our articles are not intended to be financial advice. It does not constitute a recommendation to buy or sell any stock, and does not take account of your objectives, or your financial situation. We aim to bring you long-term focused analysis driven by fundamental data. Note that our analysis may not factor in the latest price-sensitive company announcements or qualitative material. Simply Wall St has no position in any stocks mentioned.
Have feedback on this article? Concerned about the content? Get in touch with us directly. Alternatively, email editorial-team@simplywallst.com