
 Nasdaq
 華爾街日報
華爾街日報European Dividend Stocks To Enhance Your Portfolio
As the European markets navigate mixed returns, with the pan-European STOXX Europe 600 Index inching higher amid hopes for interest rate cuts in both the U.S. and UK, investors are keenly observing economic indicators like inflation and GDP growth. In this dynamic environment, dividend stocks can offer a compelling opportunity for portfolio enhancement by providing steady income streams and potential capital appreciation.
Top 10 Dividend Stocks In Europe
| Name | Dividend Yield | Dividend Rating |
| Zurich Insurance Group (SWX:ZURN) | 4.22% | ★★★★★★ |
| Telekom Austria (WBAG:TKA) | 4.61% | ★★★★★★ |
| Holcim (SWX:HOLN) | 4.12% | ★★★★★★ |
| HEXPOL (OM:HPOL B) | 4.81% | ★★★★★★ |
| Evolution (OM:EVO) | 4.86% | ★★★★★★ |
| DKSH Holding (SWX:DKSH) | 4.17% | ★★★★★★ |
| Credito Emiliano (BIT:CE) | 5.05% | ★★★★★☆ |
| Cembra Money Bank (SWX:CMBN) | 4.52% | ★★★★★★ |
| Bravida Holding (OM:BRAV) | 4.34% | ★★★★★★ |
| Afry (OM:AFRY) | 3.98% | ★★★★★☆ |
Click here to see the full list of 204 stocks from our Top European Dividend Stocks screener.
Below we spotlight a couple of our favorites from our exclusive screener.
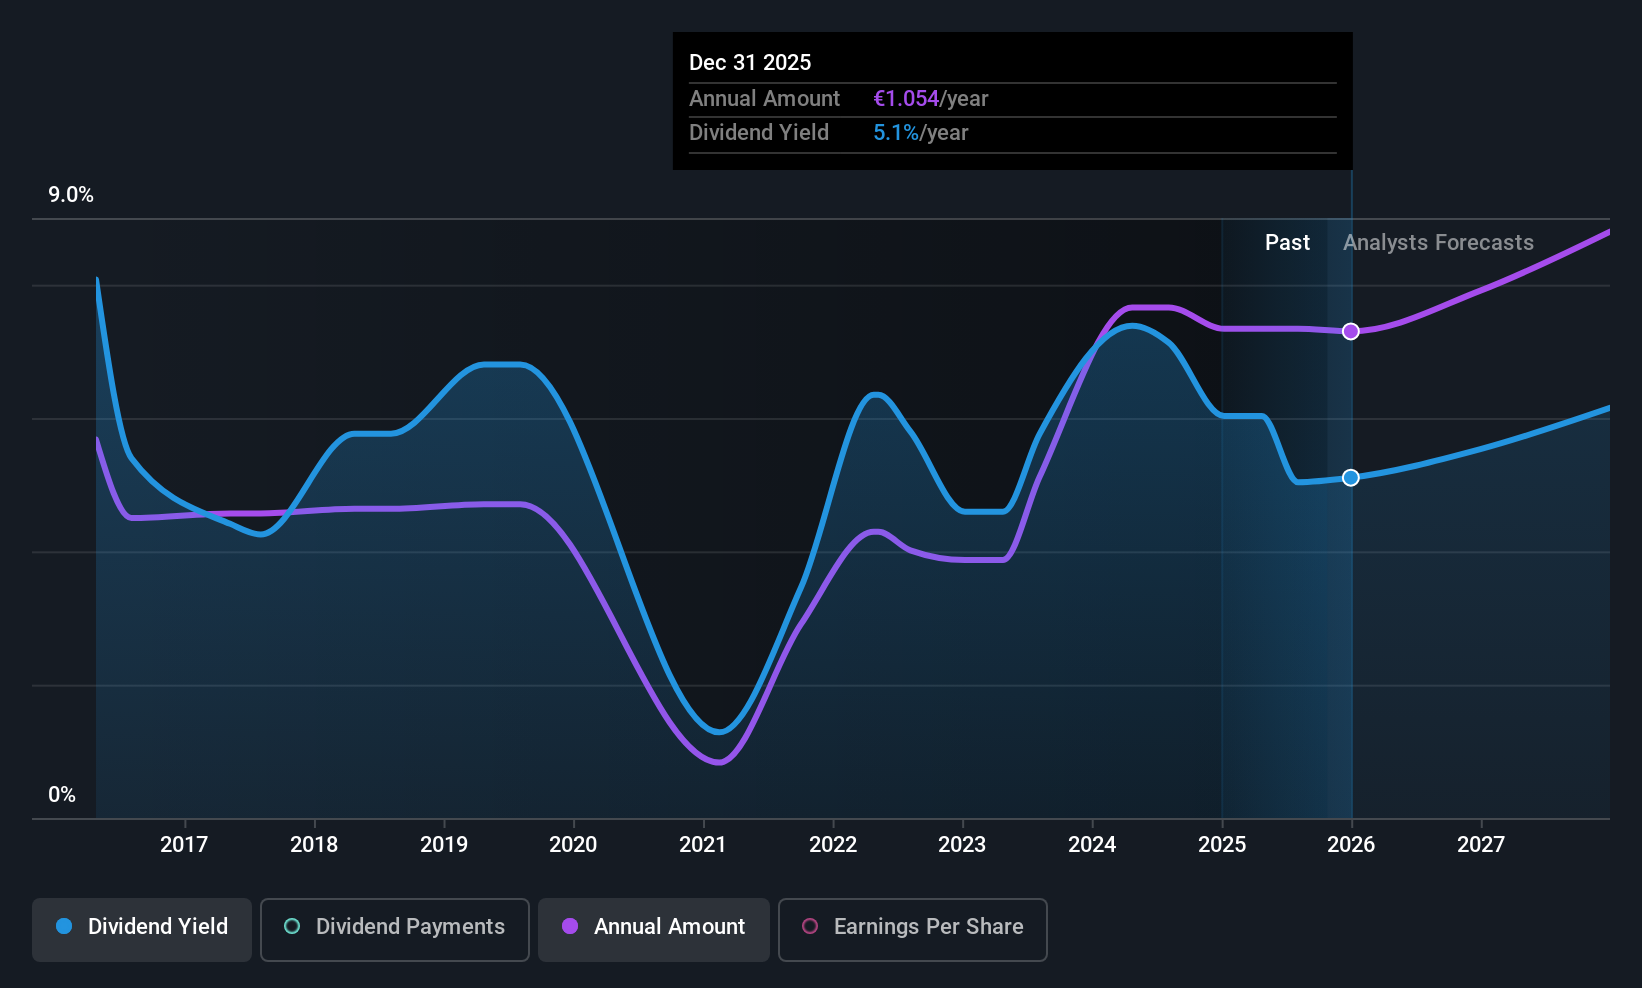
ING Groep (ENXTAM:INGA)
Simply Wall St Dividend Rating: ★★★★☆☆
Overview: ING Groep N.V. is a financial institution offering a range of banking products and services across the Netherlands, Belgium, Germany, other parts of Europe, and internationally, with a market capitalization of €68.31 billion.
Operations: ING Groep N.V.'s revenue is primarily derived from its Wholesale Banking segment (€6.42 billion) and various Retail Banking segments, including the Netherlands (€4.79 billion), Germany (€2.66 billion), Belgium (€2.45 billion), and other regions (€4.52 billion).
Dividend Yield: 4.5%
ING Groep's dividend payments have been volatile over the past decade, though they have shown some growth. The current payout ratio of 64.5% indicates dividends are covered by earnings and are forecast to remain sustainable with a projected payout ratio of 49.2% in three years. Despite trading below its estimated fair value, ING's dividend yield is lower than the top quartile of Dutch dividend payers, reflecting potential for improvement but also challenges in maintaining stable dividends amidst leadership changes.
- Click here to discover the nuances of ING Groep with our detailed analytical dividend report.
- Upon reviewing our latest valuation report, ING Groep's share price might be too optimistic.
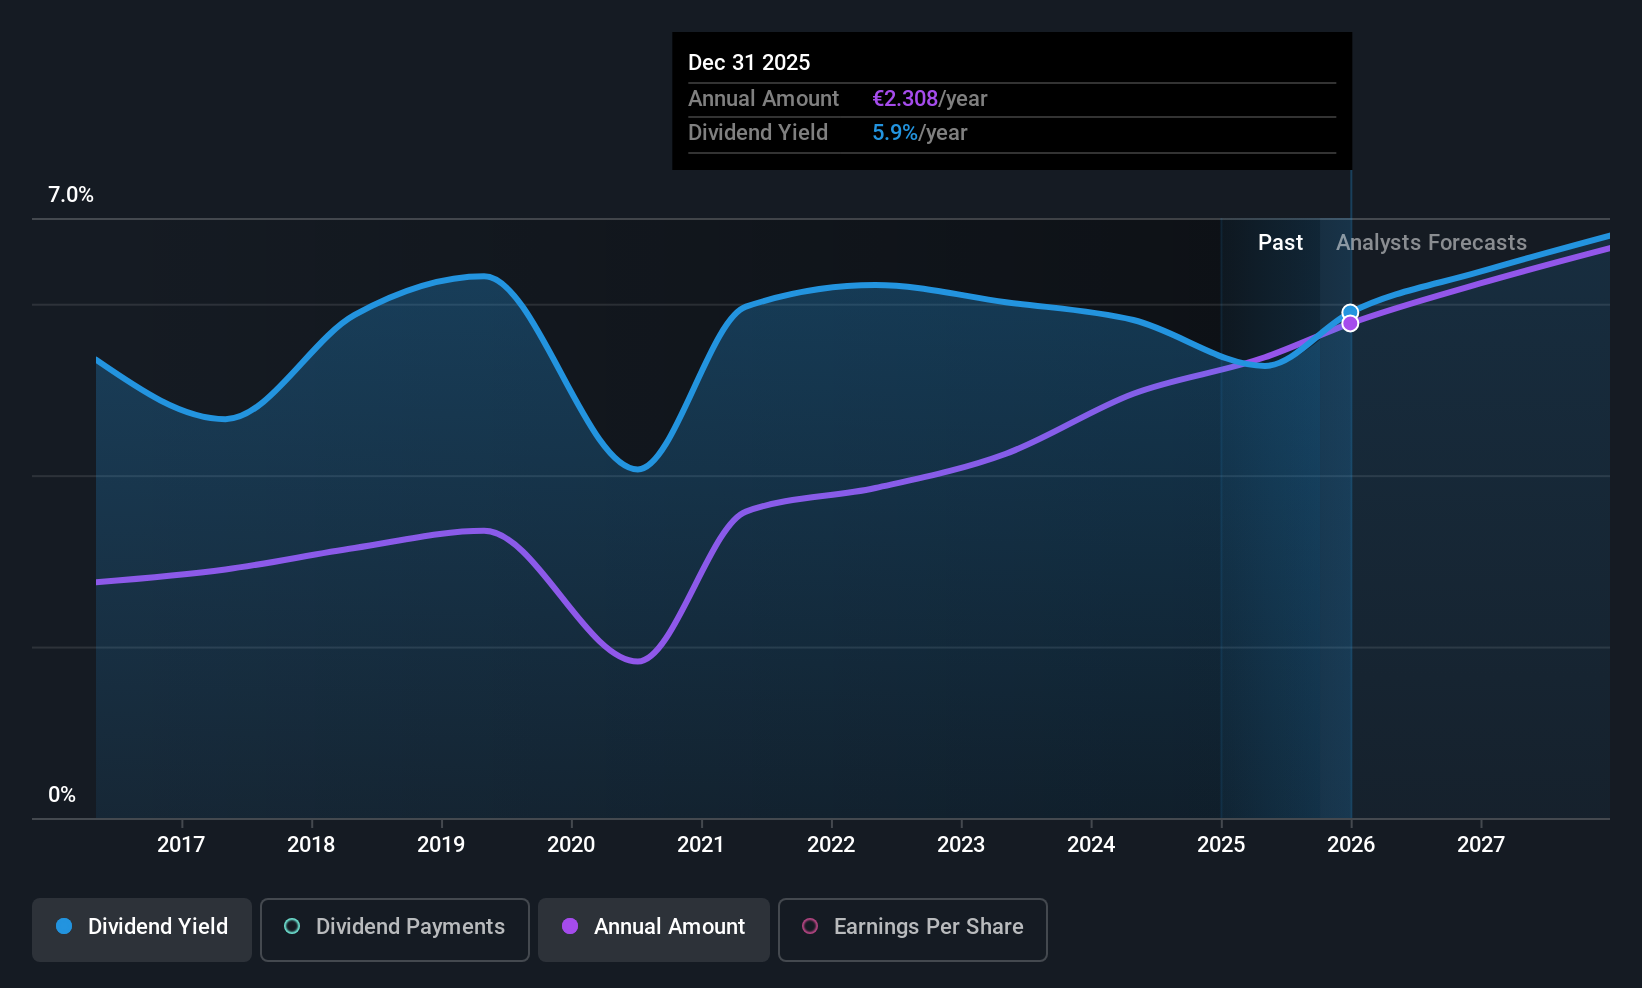
AXA (ENXTPA:CS)
Simply Wall St Dividend Rating: ★★★★☆☆
Overview: AXA SA, with a market cap of €81.47 billion, operates globally through its subsidiaries offering insurance, asset management, and banking services.
Operations: AXA's revenue is primarily derived from its segments: AXA XL (€19.92 billion), Europe (€34.84 billion), France (€23.76 billion), and Asia, Africa & EME-LATAM (€13.54 billion).
Dividend Yield: 5.4%
AXA's dividend payments have been volatile over the last decade, despite some growth. The current payout ratio of 65.3% suggests dividends are covered by earnings, while a low cash payout ratio of 21.4% indicates strong cash flow support. Although trading at a significant discount to its estimated fair value, AXA's dividend yield is slightly below the top tier in France. Recent strategic appointments and fixed-income offerings may influence future financial stability and dividend reliability.
- Get an in-depth perspective on AXA's performance by reading our dividend report here.
- In light of our recent valuation report, it seems possible that AXA is trading behind its estimated value.
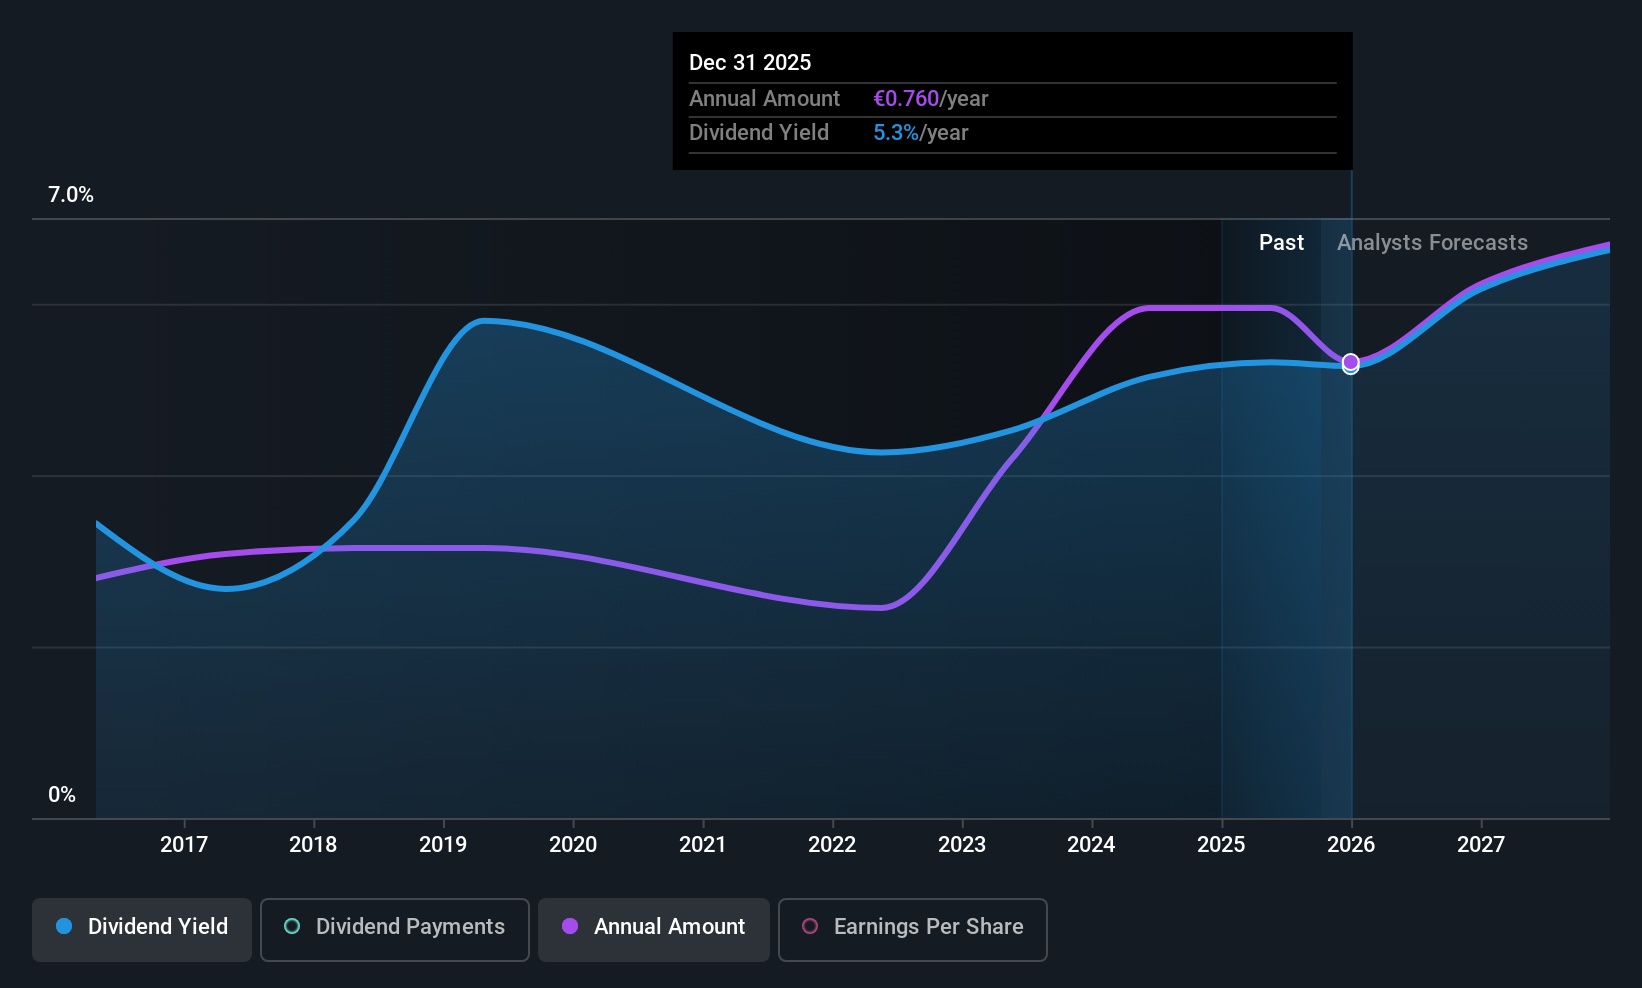
SAF-Holland (XTRA:SFQ)
Simply Wall St Dividend Rating: ★★★★★☆
Overview: SAF-Holland SE manufactures and sells chassis-related assemblies and components for trailers, trucks, semi-trailers, and buses, with a market cap of €682.93 million.
Operations: SAF-Holland SE generates revenue from its key segments, with €663.11 million from the Americas, €208.62 million from Asia/Pacific (APAC)/China/India, and €861.36 million from Europe, The Middle East, and Africa (EMEA).
Dividend Yield: 5.6%
SAF-Holland's dividend yield ranks in the top 25% of German stocks, supported by a manageable payout ratio of 68.9% and a cash payout ratio of 35.7%, indicating coverage by earnings and cash flows. However, its dividend history is marked by volatility. Recent financial guidance was lowered for fiscal year 2025, with sales expected between €1.7 billion and €1.75 billion, reflecting challenges despite an ongoing share repurchase program worth €40 million to enhance shareholder value.
- Delve into the full analysis dividend report here for a deeper understanding of SAF-Holland.
- Our valuation report here indicates SAF-Holland may be undervalued.
Where To Now?
- Delve into our full catalog of 204 Top European Dividend Stocks here.
- Invested in any of these stocks? Simplify your portfolio management with Simply Wall St and stay ahead with our alerts for any critical updates on your stocks.
- Maximize your investment potential with Simply Wall St, the comprehensive app that offers global market insights for free.
Want To Explore Some Alternatives?
- Explore high-performing small cap companies that haven't yet garnered significant analyst attention.
- Fuel your portfolio with companies showing strong growth potential, backed by optimistic outlooks both from analysts and management.
- Find companies with promising cash flow potential yet trading below their fair value.
This article by Simply Wall St is general in nature. We provide commentary based on historical data and analyst forecasts only using an unbiased methodology and our articles are not intended to be financial advice. It does not constitute a recommendation to buy or sell any stock, and does not take account of your objectives, or your financial situation. We aim to bring you long-term focused analysis driven by fundamental data. Note that our analysis may not factor in the latest price-sensitive company announcements or qualitative material. Simply Wall St has no position in any stocks mentioned.
Have feedback on this article? Concerned about the content? Get in touch with us directly. Alternatively, email editorial-team@simplywallst.com