
 Nasdaq
 華爾街日報
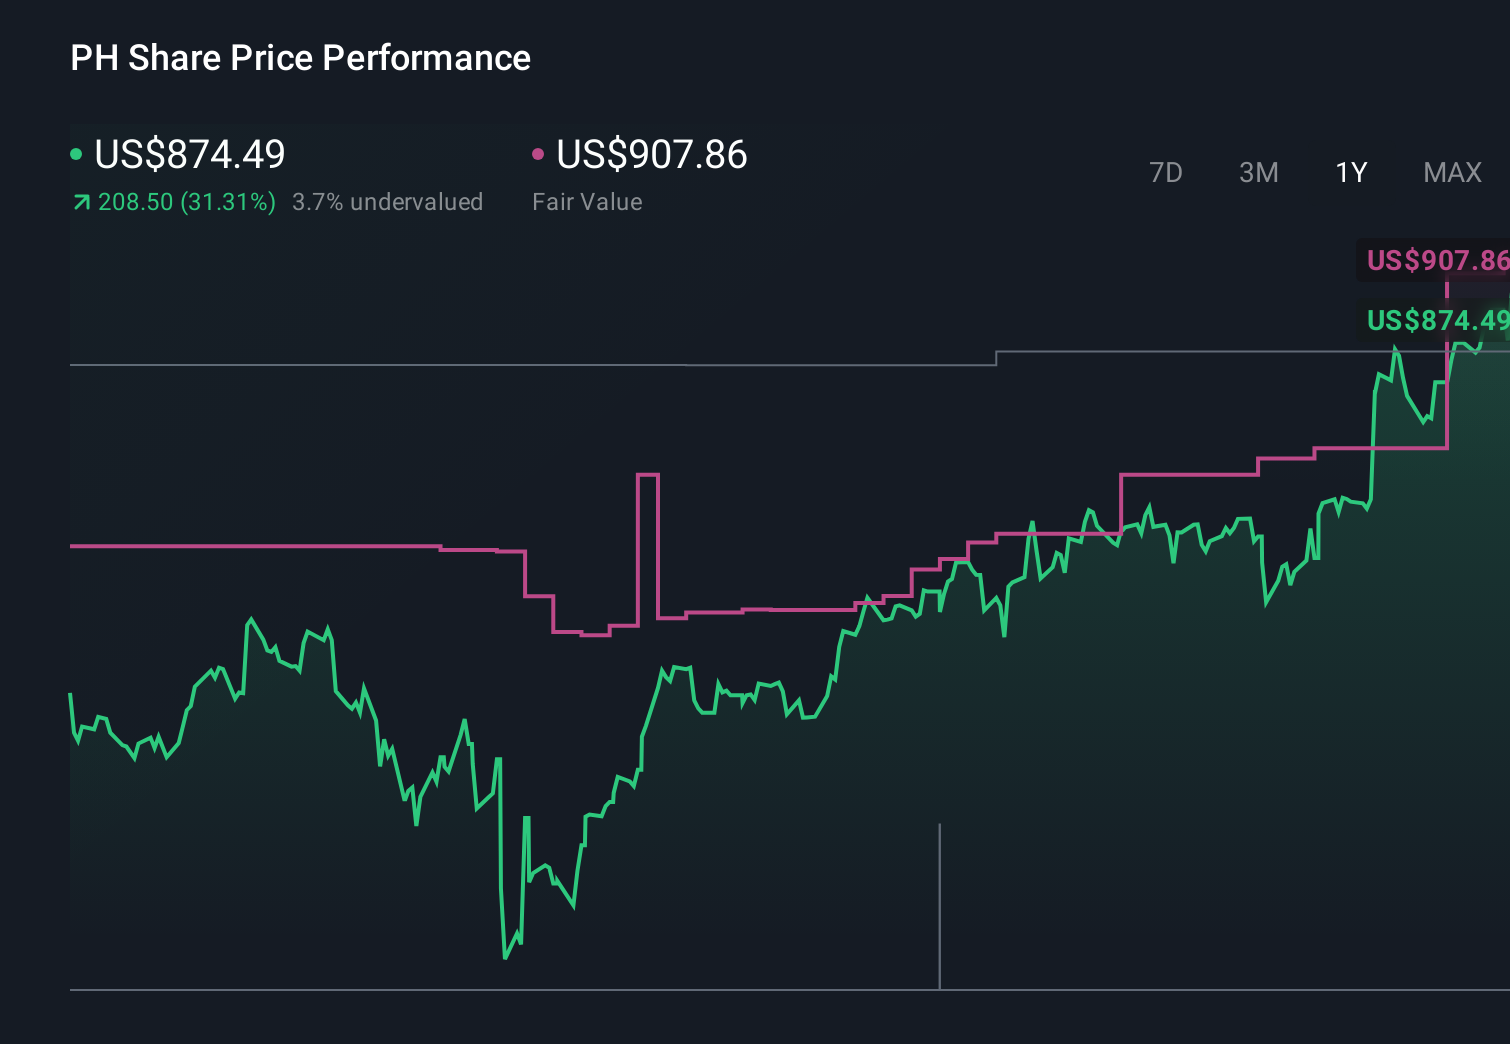
華爾街日報Is It Too Late To Consider Parker Hannifin After Its 43% Surge In 2025?
- Wondering if Parker Hannifin is still worth buying after its huge run, or if you are turning up just as the value story is fading? You are not alone in asking whether the stock still offers a good deal at today’s price.
- The share price has climbed 2.9% over the last week and 4.8% over the past month, capping a powerful move of 42.8% year to date, 33.0% over 1 year, and more than tripling with a 221.9% gain in 3 years and 251.7% in 5 years.
- Behind those moves is a broader shift in how investors see Parker Hannifin. Supply chain and industrial demand tailwinds have pushed high quality manufacturing and motion control names back into the spotlight. In particular, investors have been paying close attention to Parker Hannifin’s role in long term infrastructure, aerospace, and industrial automation spending, which has helped reframe it as a structural growth story rather than just a cyclical industrial.
- Despite that backdrop, Parker Hannifin only scores 1 out of 6 on our valuation checks. In the sections that follow we will unpack what different valuation approaches are really saying about the stock today, and finish by looking at a deeper way to think about value beyond just the headline numbers.
Parker-Hannifin scores just 1/6 on our valuation checks. See what other red flags we found in the full valuation breakdown.
Approach 1: Parker-Hannifin Discounted Cash Flow (DCF) Analysis
The Discounted Cash Flow, or DCF, model estimates what a company is worth by projecting its future cash flows and then discounting those back to today’s dollars.
For Parker-Hannifin, the latest twelve month free cash flow is about $3.4 billion. Analysts expect this to rise steadily over the next decade, with Simply Wall St extending analyst forecasts beyond year five to build a full long term view. By 2029, projected free cash flow is just over $4.9 billion, and by 2035 the model extrapolates it to roughly $6.0 billion, all in $.
When these cash flows are discounted back to today using a 2 Stage Free Cash Flow to Equity model, Parker-Hannifin’s intrinsic value comes out at roughly $665.64 per share. Compared with the current share price, this suggests the stock is about 35.1% overvalued rather than offering a hidden bargain.
Result: OVERVALUED
Our Discounted Cash Flow (DCF) analysis suggests Parker-Hannifin may be overvalued by 35.1%. Discover 905 undervalued stocks or create your own screener to find better value opportunities.

Approach 2: Parker-Hannifin Price vs Earnings
For profitable businesses like Parker Hannifin, the price to earnings, or PE, ratio is a useful way to gauge value because it links what you pay directly to the profits the company is generating today. In general, faster expected earnings growth and lower perceived risk justify a higher PE, while slower growth or higher uncertainty usually call for a lower, more conservative multiple.
Parker Hannifin currently trades on a PE of about 31.2x. That is above the broader Machinery industry average of roughly 26.0x, but sits below the 36.6x average of its closest peers. This suggests investors are already paying a premium for its quality and outlook, though not the highest in the group. Simply Wall St also calculates a proprietary Fair Ratio of 29.9x, which reflects what the PE should be given Parker Hannifin’s earnings growth profile, profitability, industry, size, and risk characteristics.
Because the Fair Ratio blends these company specific factors, it offers a more tailored benchmark than a simple comparison to peers or the sector. With the current PE modestly above the 29.9x Fair Ratio, Parker Hannifin screens as slightly expensive on an earnings basis.
Result: OVERVALUED

PE ratios tell one story, but what if the real opportunity lies elsewhere? Discover 1445 companies where insiders are betting big on explosive growth.
Upgrade Your Decision Making: Choose your Parker-Hannifin Narrative
Earlier we mentioned that there is an even better way to understand valuation, so let us introduce you to Narratives, a simple way for you to attach a story, your assumptions about Parker-Hannifin’s future revenues, earnings and margins, to the numbers so that the company’s story connects directly to a financial forecast and, ultimately, to a fair value estimate.
On Simply Wall St’s Community page, used by millions of investors, Narratives turn this story plus forecast into a clear Fair Value that you can compare with today’s share price to decide whether Parker-Hannifin looks like a buy, a hold, or a sell. They also automatically update when new information such as earnings releases, guidance changes, or major news (like repurchases and revised growth assumptions) comes in.
For Parker-Hannifin, one Narrative might reflect a more optimistic view that sees long term revenue growth near 5.9%, resilient margins around 17.9%, and a higher future PE of about 32x leading to a Fair Value near 908 dollars. A more cautious Narrative might lean toward the lower analyst target of 500 dollars, so by comparing these different perspectives to the current price you can choose the story, and decision, that best fits your own expectations.
Do you think there's more to the story for Parker-Hannifin? Head over to our Community to see what others are saying!
This article by Simply Wall St is general in nature. We provide commentary based on historical data and analyst forecasts only using an unbiased methodology and our articles are not intended to be financial advice. It does not constitute a recommendation to buy or sell any stock, and does not take account of your objectives, or your financial situation. We aim to bring you long-term focused analysis driven by fundamental data. Note that our analysis may not factor in the latest price-sensitive company announcements or qualitative material. Simply Wall St has no position in any stocks mentioned.
Have feedback on this article? Concerned about the content? Get in touch with us directly. Alternatively, email editorial-team@simplywallst.com