
 Nasdaq
 華爾街日報
華爾街日報Has Commvault’s Recent Share Price Slide Created a Fair Entry Point in 2025?
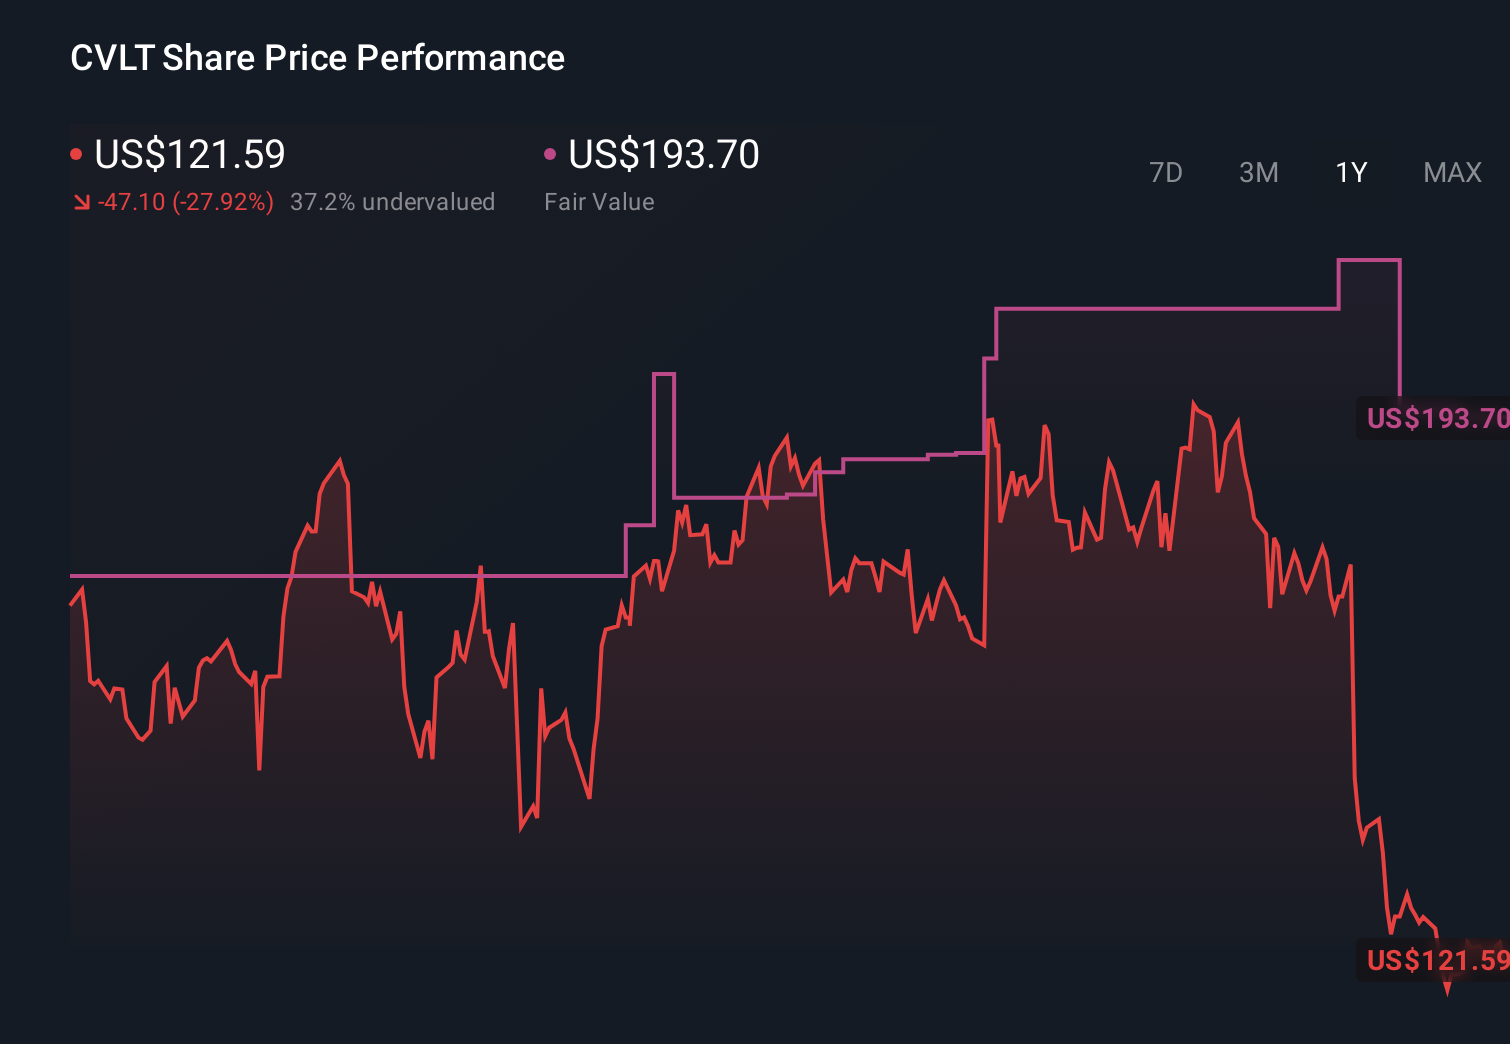
- If you are wondering whether Commvault Systems at around $124 a share is a bargain, a bubble, or simply fairly priced, you are not alone. This article is designed to unpack exactly what you are paying for.
- The stock is down 18.4% year to date and 28.3% over the last 12 months, but those drops follow a 96.4% gain over 3 years and 136.0% over 5 years. That combination points to a mix of long term strength and shifting market expectations.
- Recent headlines have focused on Commvault expanding its SaaS based data protection and cyber resilience offerings, as enterprises rethink how they secure and manage critical information in hybrid and multi cloud environments. The market has also been digesting commentary around intensifying competition in backup, recovery, and security adjacent tools, which helps explain why sentiment has become more cautious despite the company’s strategic progress.
- On our framework of 6 valuation checks, Commvault scores just 2/6 for being undervalued. We will walk through what that means across multiples, cash flow, and asset based approaches, then finish by looking at a more nuanced way to think about valuation that links the numbers back to the company’s long term narrative.
Commvault Systems scores just 2/6 on our valuation checks. See what other red flags we found in the full valuation breakdown.
Approach 1: Commvault Systems Discounted Cash Flow (DCF) Analysis
A Discounted Cash Flow model estimates what a business is worth by projecting the cash it can generate in the future and then discounting those cash flows back to today in dollar terms. For Commvault Systems, the 2 stage Free Cash Flow to Equity model starts with last twelve month free cash flow of about $209.8 million and builds in analyst expectations for growth over the next several years.
Analysts see free cash flow rising to roughly $227.4 million in 2026 and $270.1 million in 2027, with projections reaching about $442.8 million by 2035. Only the early years are based on explicit analyst estimates, while the later numbers are extrapolated using gradually slowing growth assumptions. When all these projected cash flows are discounted back to today, the model produces an intrinsic value of about $126.36 per share.
Compared with the current share price around $124, the DCF suggests Commvault stock is only about 1.8% undervalued, which is effectively in the fair value range for most long term investors.
Result: ABOUT RIGHT
Commvault Systems is fairly valued according to our Discounted Cash Flow (DCF), but this can change at a moment's notice. Track the value in your watchlist or portfolio and be alerted on when to act.

Approach 2: Commvault Systems Price vs Earnings
For profitable software businesses like Commvault, the price to earnings ratio is a useful way to gauge how much investors are willing to pay today for each dollar of current profits. A higher PE can be justified when the market expects faster, more reliable growth and sees fewer risks ahead, while slower growth or higher uncertainty usually call for a lower, more conservative multiple.
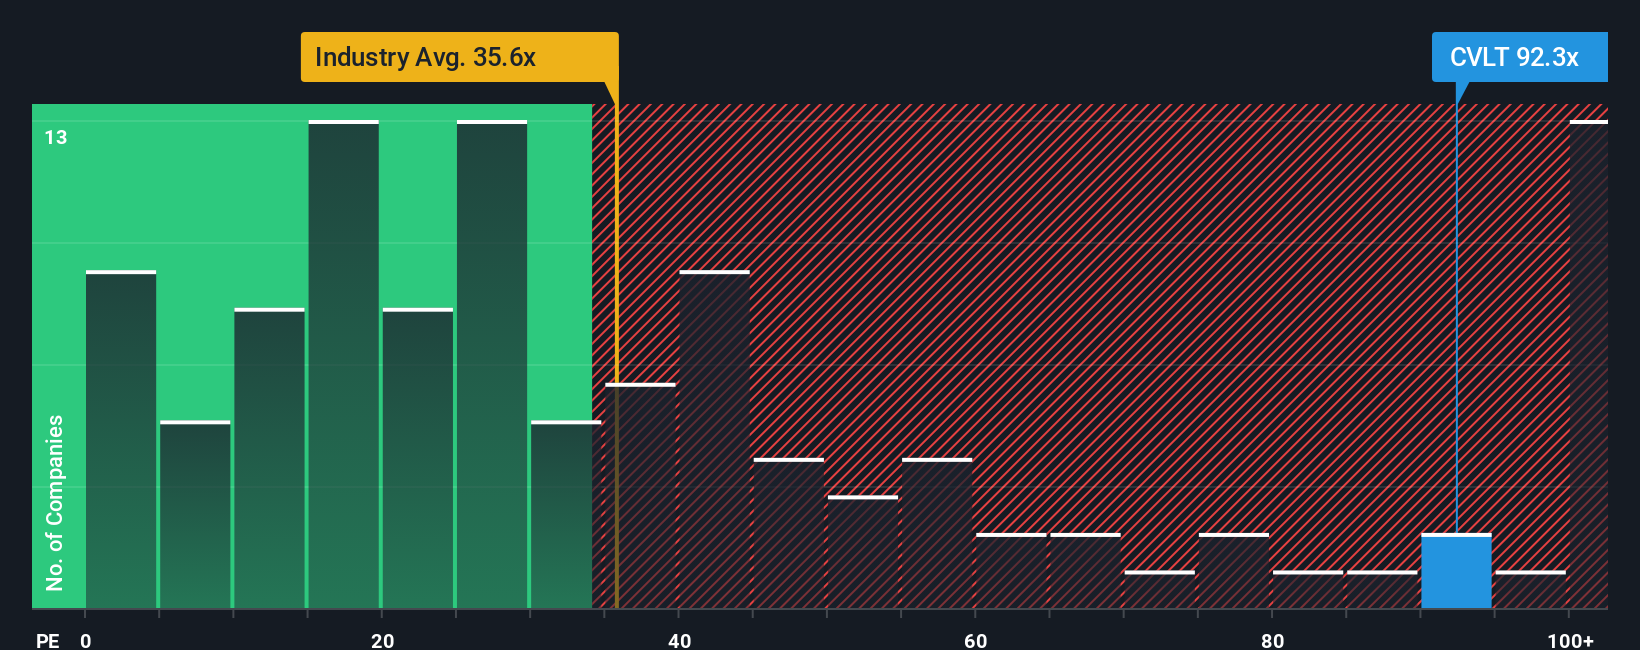
Commvault currently trades on a PE of about 68.20x, well above the broader Software industry average of roughly 32.73x and also above its peer group average of around 56.11x. To put those comparisons into better context, Simply Wall St calculates a proprietary “Fair Ratio” of 34.21x, which reflects what might be reasonable for Commvault’s specific mix of earnings growth, margins, risk profile, industry and market cap.
This Fair Ratio is more tailored than a simple industry or peer comparison because it adjusts for the company’s own fundamentals rather than assuming all software names deserve similar valuations. When compared with that 34.21x fair level, Commvault’s current 68.20x PE suggests the shares are trading at a significant premium.
Result: OVERVALUED
PE ratios tell one story, but what if the real opportunity lies elsewhere? Discover 1445 companies where insiders are betting big on explosive growth.
Upgrade Your Decision Making: Choose your Commvault Systems Narrative
Earlier we mentioned that there is an even better way to understand valuation, so let us introduce you to Narratives. These allow you to attach a clear story to your numbers by stating what you believe about a company’s future revenue, earnings and margins, linking that story to a financial forecast and then to an explicit fair value that you can easily compare with today’s price. On Simply Wall St, Narratives sit inside the Community page and are simple, guided tools used by millions of investors to turn their views into structured scenarios that highlight whether a stock looks undervalued, overvalued or fairly priced. They automatically refresh as new news, earnings or guidance come in so your view stays up to date without you constantly rebuilding models. For Commvault Systems, one investor might build a bullish Narrative that assumes revenue growth near 12% a year, margins trending toward 11 to 12%, and a fair value around $225 per share. A more cautious investor might emphasize shorter contracts and margin pressure, assume lower earnings nearer $144 million and a fair value closer to $167. Each then has a clear, numbers backed basis for deciding when to buy, hold or sell.
Do you think there's more to the story for Commvault Systems? Head over to our Community to see what others are saying!
This article by Simply Wall St is general in nature. We provide commentary based on historical data and analyst forecasts only using an unbiased methodology and our articles are not intended to be financial advice. It does not constitute a recommendation to buy or sell any stock, and does not take account of your objectives, or your financial situation. We aim to bring you long-term focused analysis driven by fundamental data. Note that our analysis may not factor in the latest price-sensitive company announcements or qualitative material. Simply Wall St has no position in any stocks mentioned.
Have feedback on this article? Concerned about the content? Get in touch with us directly. Alternatively, email editorial-team@simplywallst.com