
 Nasdaq
 華爾街日報
華爾街日報We Think Vedant Fashions (NSE:MANYAVAR) Might Have The DNA Of A Multi-Bagger
Did you know there are some financial metrics that can provide clues of a potential multi-bagger? In a perfect world, we'd like to see a company investing more capital into its business and ideally the returns earned from that capital are also increasing. If you see this, it typically means it's a company with a great business model and plenty of profitable reinvestment opportunities. With that in mind, the ROCE of Vedant Fashions (NSE:MANYAVAR) looks great, so lets see what the trend can tell us.
Return On Capital Employed (ROCE): What Is It?
For those who don't know, ROCE is a measure of a company's yearly pre-tax profit (its return), relative to the capital employed in the business. Analysts use this formula to calculate it for Vedant Fashions:
Return on Capital Employed = Earnings Before Interest and Tax (EBIT) ÷ (Total Assets - Current Liabilities)
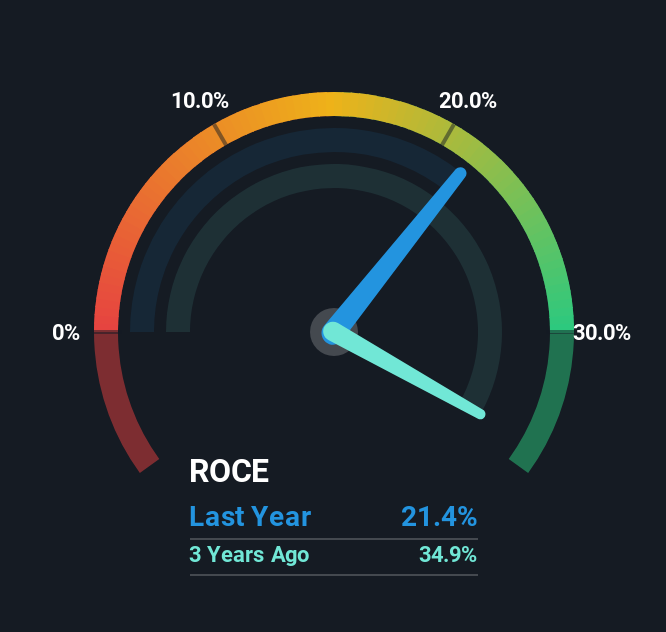
0.21 = ₹4.8b ÷ (₹26b - ₹3.8b) (Based on the trailing twelve months to September 2025).
So, Vedant Fashions has an ROCE of 21%. That's a fantastic return and not only that, it outpaces the average of 11% earned by companies in a similar industry.
View our latest analysis for Vedant Fashions
In the above chart we have measured Vedant Fashions' prior ROCE against its prior performance, but the future is arguably more important. If you're interested, you can view the analysts predictions in our free analyst report for Vedant Fashions .
What Can We Tell From Vedant Fashions' ROCE Trend?
The trends we've noticed at Vedant Fashions are quite reassuring. Over the last five years, returns on capital employed have risen substantially to 21%. The amount of capital employed has increased too, by 64%. This can indicate that there's plenty of opportunities to invest capital internally and at ever higher rates, a combination that's common among multi-baggers.
Our Take On Vedant Fashions' ROCE
To sum it up, Vedant Fashions has proven it can reinvest in the business and generate higher returns on that capital employed, which is terrific. Given the stock has declined 56% in the last three years, this could be a good investment if the valuation and other metrics are also appealing. So researching this company further and determining whether or not these trends will continue seems justified.
Before jumping to any conclusions though, we need to know what value we're getting for the current share price. That's where you can check out our FREE intrinsic value estimation for MANYAVAR that compares the share price and estimated value.
High returns are a key ingredient to strong performance, so check out our free list ofstocks earning high returns on equity with solid balance sheets.
Have feedback on this article? Concerned about the content? Get in touch with us directly. Alternatively, email editorial-team (at) simplywallst.com.
This article by Simply Wall St is general in nature. We provide commentary based on historical data and analyst forecasts only using an unbiased methodology and our articles are not intended to be financial advice. It does not constitute a recommendation to buy or sell any stock, and does not take account of your objectives, or your financial situation. We aim to bring you long-term focused analysis driven by fundamental data. Note that our analysis may not factor in the latest price-sensitive company announcements or qualitative material. Simply Wall St has no position in any stocks mentioned.