
 Nasdaq
 華爾街日報
華爾街日報Is Medpace Still Attractive After Its Huge Multi Year Share Price Surge in 2025
- Wondering if Medpace Holdings is still worth buying after its huge run, or if the smart move now is to wait for a better entry point? You are not alone, and that is exactly what we are going to unpack here.
- The stock has pulled back about 6.1% over the last month after a strong year to date jump of 69.1%, and a hefty 63.0% gain over the past year. Zooming out further, Medpace is up 175.1% over three years and 279.5% over five, which naturally raises the question of how much upside is left.
- Recent headlines around Medpace continue to highlight its role as a key clinical research partner for biotech and pharma companies, reinforcing the narrative that it is a picks and shovels play on drug development. That backdrop helps explain why investors have been willing to pay up for growth, even as sentiment has cooled a bit in recent weeks.
- On our framework of six valuation checks, Medpace scores a 2 out of 6, meaning it screens as undervalued on only a couple of metrics and looks stretched on others. In the sections ahead, we will walk through the main valuation approaches behind that score, and then finish with a more holistic way to think about what the stock is really worth.
Medpace Holdings scores just 2/6 on our valuation checks. See what other red flags we found in the full valuation breakdown.
Approach 1: Medpace Holdings Discounted Cash Flow (DCF) Analysis
A Discounted Cash Flow model projects a company’s future cash flows and then discounts them back to today, aiming to estimate what the entire business is worth in present value terms.
For Medpace Holdings, the latest twelve month Free Cash Flow is about $669.7 million, and analysts, along with Simply Wall St’s extrapolations, see this rising steadily over time. By 2029, projected Free Cash Flow reaches roughly $851.6 million, and longer term estimates out to 2035 continue to grow in a moderated fashion. All of these future cash flows are discounted using a 2 Stage Free Cash Flow to Equity model to reflect risk and the time value of money.
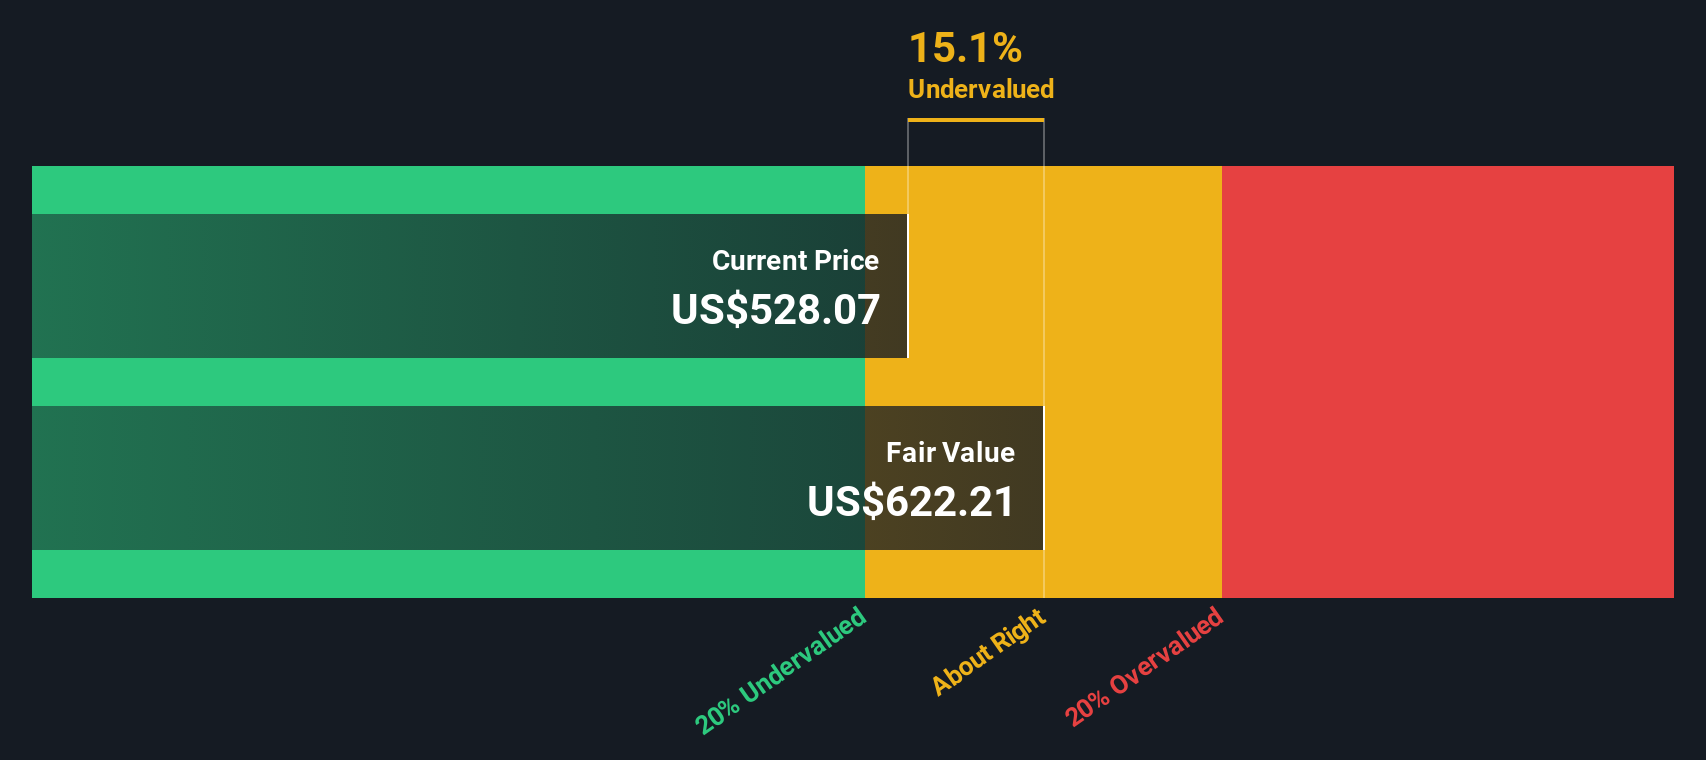
On this basis, the DCF model arrives at an estimated intrinsic value of about $677.5 per share. Compared with the current share price, this implies the stock is trading at roughly a 16.4% discount. Based on these cash flow assumptions and valuation inputs, Medpace appears to be trading below this DCF-derived estimate of intrinsic value.
Result: UNDERVALUED
Our Discounted Cash Flow (DCF) analysis suggests Medpace Holdings is undervalued by 16.4%. Track this in your watchlist or portfolio, or discover 905 more undervalued stocks based on cash flows.
Approach 2: Medpace Holdings Price vs Earnings
For a consistently profitable company like Medpace, the Price to Earnings ratio is a useful way to gauge how much investors are paying for each dollar of current earnings. The higher the expected growth and the lower the perceived risk, the more investors are usually willing to pay, so a higher or lower PE ratio can often be explained by those two forces.
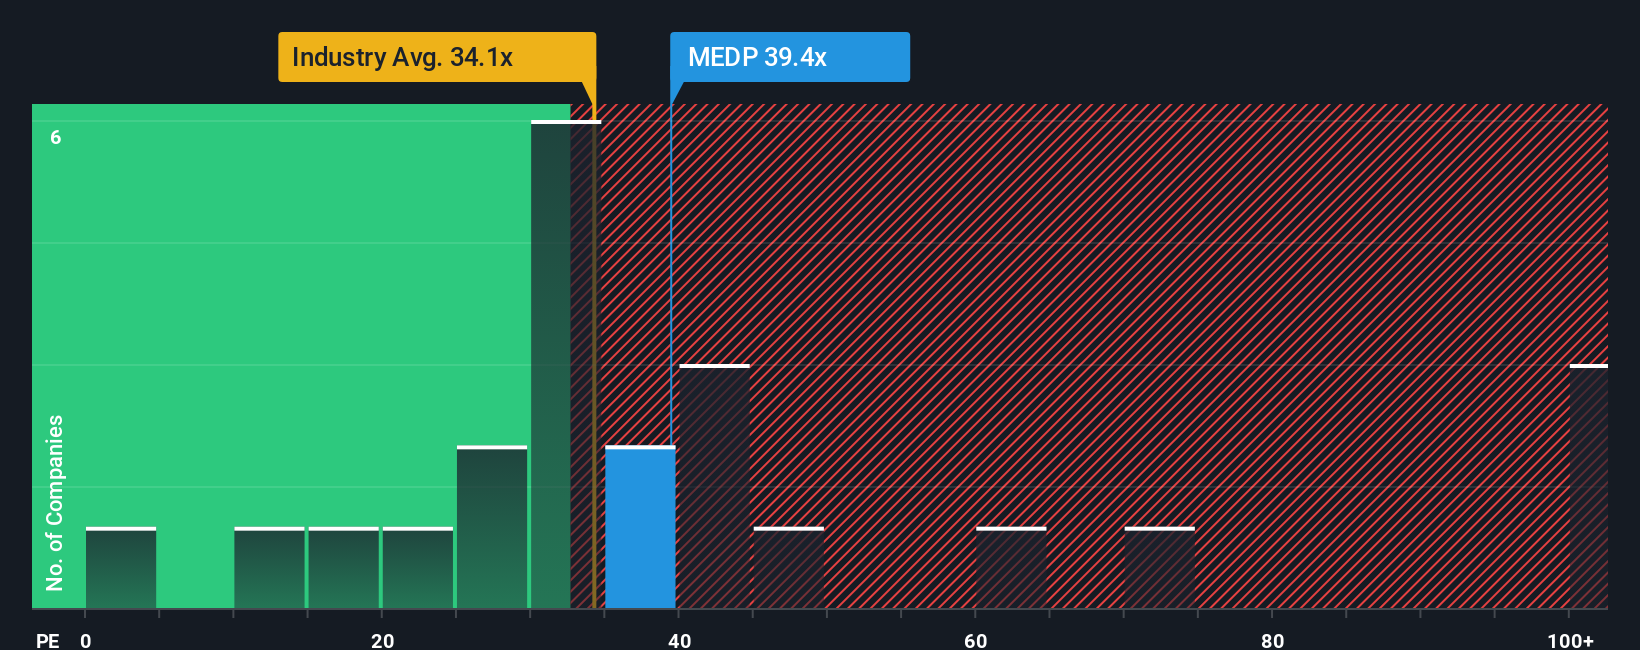
Medpace currently trades on a PE of about 36.8x, which sits above the broader Life Sciences industry average of roughly 34.4x, but below the peer group average of around 53.5x. To move beyond simple comparisons, Simply Wall St also calculates a Fair Ratio, an estimate of what a normal PE should be for this specific business given its earnings growth outlook, profitability, industry, size and risk profile.
Because this Fair Ratio framework is tailored to Medpace’s fundamentals, it gives a more nuanced view than just lining the stock up against peers or the industry, which may have very different growth and risk characteristics. In Medpace’s case, the Fair Ratio is estimated at about 25.0x, noticeably below the current 36.8x, which suggests the shares are pricing in more optimism than the model supports.
Result: OVERVALUED
PE ratios tell one story, but what if the real opportunity lies elsewhere? Discover 1445 companies where insiders are betting big on explosive growth.
Upgrade Your Decision Making: Choose your Medpace Holdings Narrative
Earlier we mentioned that there is an even better way to understand valuation, so let us introduce you to Narratives, a simple way to connect your view of Medpace’s business to a financial forecast and then to a clear fair value, by telling the story behind your assumptions for future revenue, earnings and margins, and seeing how that stacks up against today’s share price.
On Simply Wall St’s Community page, Narratives are an easy, accessible tool used by millions of investors to map their thesis into numbers, compare the resulting fair value with the current price to decide whether to buy, hold or sell, and then have that view dynamically updated whenever new information like news or earnings hits the market.
For Medpace, for example, one investor might build a Narrative that leans closer to the more bullish outlook implied by a fair value near $539, assuming resilient demand and solid margins. Another could anchor on the more cautious end of the range, closer to the lowest external price target of about $305, if they believe backlog risk and funding pressures will weigh more heavily on growth and profitability.
Do you think there's more to the story for Medpace Holdings? Head over to our Community to see what others are saying!

This article by Simply Wall St is general in nature. We provide commentary based on historical data and analyst forecasts only using an unbiased methodology and our articles are not intended to be financial advice. It does not constitute a recommendation to buy or sell any stock, and does not take account of your objectives, or your financial situation. We aim to bring you long-term focused analysis driven by fundamental data. Note that our analysis may not factor in the latest price-sensitive company announcements or qualitative material. Simply Wall St has no position in any stocks mentioned.
Have feedback on this article? Concerned about the content? Get in touch with us directly. Alternatively, email editorial-team@simplywallst.com