
 Nasdaq
 華爾街日報
華爾街日報Has Cognex’s Long Slide and Recent Pullback Created an Opportunity in 2025?
- Wondering if Cognex at around $36.88 is a bargain in disguise or a value trap in plain sight? This article walks through what the numbers are really saying about the stock.
- Despite being up 3.3% year to date, Cognex shares have slipped 5.2% over the last week and 4.0% over the last month, capping off a much rougher 3-year slide of 23.6% and a 52.3% drop over 5 years that has clearly reset expectations.
- Recent moves have come as investors reassess machine vision and factory automation names amid shifting industrial demand and ongoing debates about how fast AI driven automation will translate into revenue growth. Cognex has been part of that conversation as a bellwether for capital spending on smarter production lines and logistics systems, which helps explain why sentiment has been so sensitive to macro headlines.
- On our checklist of 6 valuation tests, Cognex scores a 3 (you can dig into this via its 3/6 valuation score). We will break down what different valuation approaches say about that middling result and, by the end, explore an even more insightful way to think about what the stock is really worth.
Find out why Cognex's -1.3% return over the last year is lagging behind its peers.
Approach 1: Cognex Discounted Cash Flow (DCF) Analysis
The Discounted Cash Flow model estimates what a stock is worth by projecting the cash a business is expected to generate in the future, then discounting those cash flows back into today’s dollars.
For Cognex, the latest twelve month free cash flow is about $204.9 million, and analysts expect this to grow steadily as automation demand recovers. Projections used in this 2 stage Free Cash Flow to Equity model see free cash flow rising to roughly $583 million by 2035, with analyst estimates guiding the next few years and Simply Wall St extrapolating further out to 10 years.
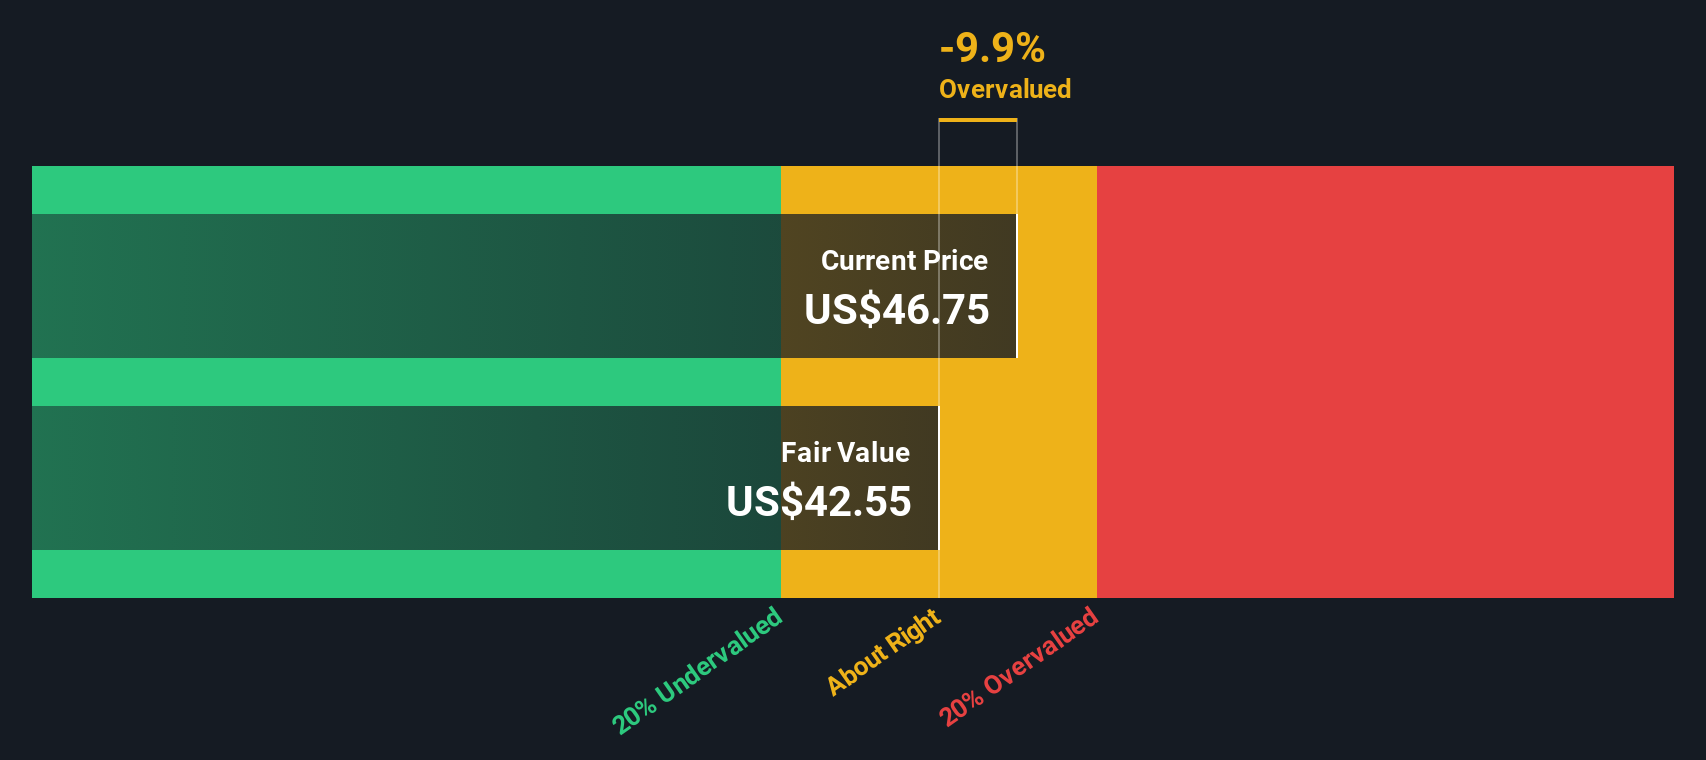
When all of those future cash flows are discounted back to today, the model arrives at an intrinsic value of about $46.63 per share. Compared with the recent share price around $36.88, that implies Cognex is trading at roughly a 20.9% discount to its DCF based fair value. This indicates the market may not be fully pricing in its long term cash generation potential.
Result: UNDERVALUED
Our Discounted Cash Flow (DCF) analysis suggests Cognex is undervalued by 20.9%. Track this in your watchlist or portfolio, or discover 905 more undervalued stocks based on cash flows.
Approach 2: Cognex Price vs Earnings
For profitable companies like Cognex, the price to earnings ratio is a straightforward way to see how much investors are willing to pay today for each dollar of current earnings. A higher PE generally reflects stronger growth expectations or lower perceived risk, while slower growing or riskier businesses tend to justify lower PE multiples.
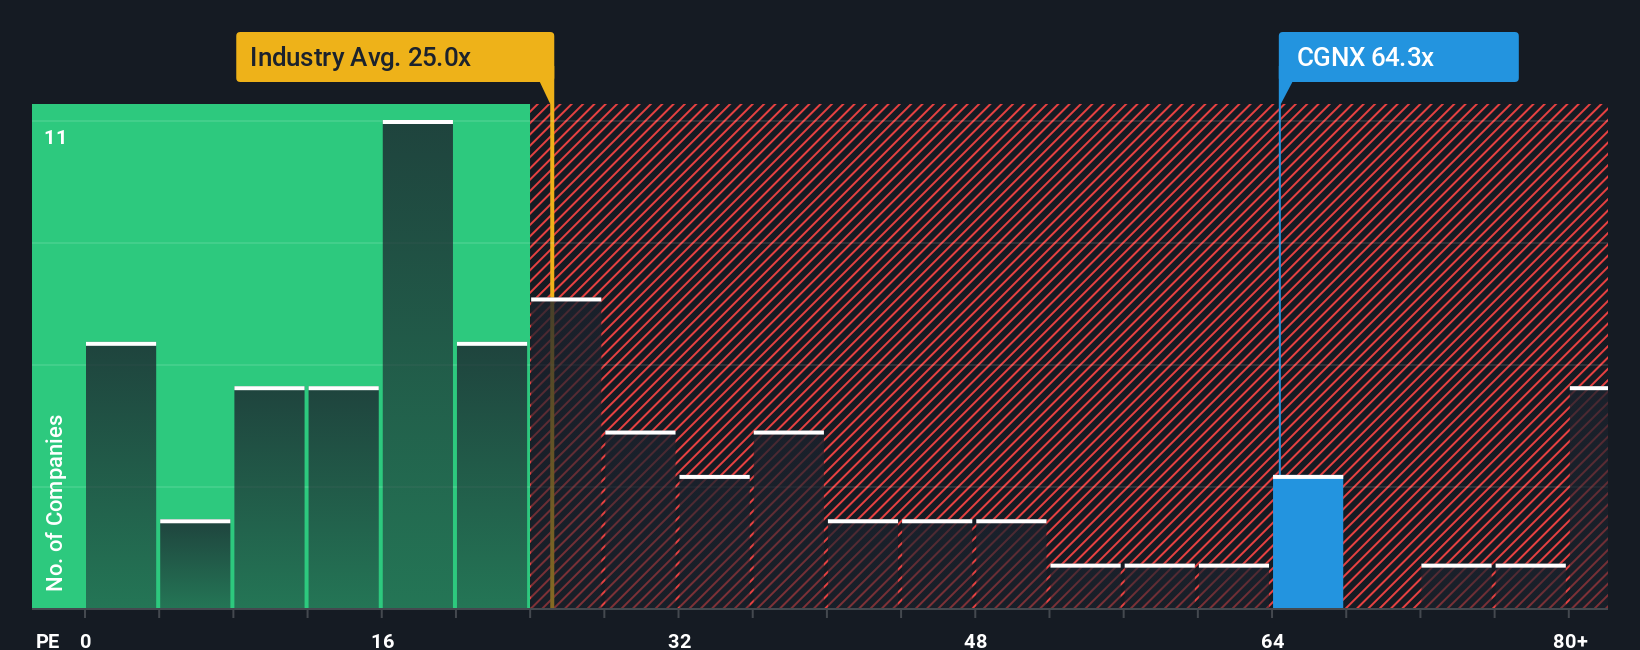
Cognex currently trades on a PE of about 56.1x, which is rich compared with the broader Electronic industry average of roughly 25.4x and even above its peer group average of around 44.5x. To go a step further, Simply Wall St calculates a proprietary “Fair Ratio” of 31.9x, which estimates the PE that would be appropriate given Cognex’s specific earnings growth outlook, profitability, industry position, market cap and risk profile.
This Fair Ratio offers a more tailored benchmark than simple peer or industry comparisons, because it adjusts for how fast Cognex is expected to grow and how risky its earnings stream is. With the shares trading at 56.1x versus a Fair Ratio of 31.9x, the stock looks materially more expensive than what those fundamentals would justify.
Result: OVERVALUED
PE ratios tell one story, but what if the real opportunity lies elsewhere? Discover 1446 companies where insiders are betting big on explosive growth.
Upgrade Your Decision Making: Choose your Cognex Narrative
Earlier we mentioned that there is an even better way to understand valuation, so let us introduce you to Narratives, which are simply your own story about a company, translated into assumptions for future revenue, earnings and margins, and then into a fair value that you can compare directly with today’s price. On Simply Wall St’s Community page, millions of investors use Narratives as an easy, accessible tool to connect what they believe about a business to a concrete financial forecast and a live fair value estimate that automatically updates when new information like earnings, guidance or news hits the market. For Cognex, one investor might build a bullish Narrative that leans into AI powered vision, margin expansion and activist driven cost discipline, landing on a fair value closer to $58. A more cautious investor could instead focus on commoditization, cyclicality and execution risk, and anchor their Narrative around $35. Those differing stories help each investor decide whether Cognex looks like a buy, hold or sell relative to its current share price.
Do you think there's more to the story for Cognex? Head over to our Community to see what others are saying!
This article by Simply Wall St is general in nature. We provide commentary based on historical data and analyst forecasts only using an unbiased methodology and our articles are not intended to be financial advice. It does not constitute a recommendation to buy or sell any stock, and does not take account of your objectives, or your financial situation. We aim to bring you long-term focused analysis driven by fundamental data. Note that our analysis may not factor in the latest price-sensitive company announcements or qualitative material. Simply Wall St has no position in any stocks mentioned.
Have feedback on this article? Concerned about the content? Get in touch with us directly. Alternatively, email editorial-team@simplywallst.com