
 Nasdaq
 華爾街日報
華爾街日報Assessing Amentum (AMTM) Valuation After Major CTRIC IV and DISA Contract Wins
Amentum Holdings (AMTM) just added another long term growth lever, landing a prime spot on the Defense Threat Reduction Agency's $3.5 billion CTRIC IV program alongside a fresh $120 million DISA computing services win.
See our latest analysis for Amentum Holdings.
Those twin defense wins seem to be feeding into the story, with the latest share price at $30.13 and a punchy 1 month share price return of 31.23% capping a 39.10% year to date share price gain. This suggests momentum is building as investors reassess Amentum's contract driven growth runway versus past concerns about slower organic expansion and efficiency.
If contracts like CTRIC IV have you watching the defense space more closely, this could be a good moment to scan other opportunities across aerospace and defense stocks.
With the stock up nearly 40% year to date, but still trading at a double digit discount to analyst targets and a steep discount to some intrinsic value estimates, is Amentum a mispriced compounder, or is the market already baking in the next leg of growth?
Price-to-Earnings of 111.2x: Is it justified?
Amentum is trading on a steep 111.2x price-to-earnings multiple at the last close of $30.13, a level that screens as clearly overvalued versus peers.
The price-to-earnings ratio compares the share price to the company’s earnings per share, giving a snapshot of how much investors are willing to pay for each dollar of current profit. For a contract driven government services and engineering business, it is a widely watched yardstick because earnings power tends to be more stable and visible than in early stage or pre profit sectors.
In Amentum’s case, the premium multiple suggests the market is placing a high value on its newly profitable status and the prospect of earnings compounding quickly from a low base. However, when stacked against an estimated “fair” price to earnings ratio of 34x implied by our fair ratio work, the gap is striking and points to a valuation that could face pressure if execution or growth expectations wobble.
That disconnect is even clearer when compared with the US Professional Services industry average multiple of 24.5x and a peer average of 18.9x, meaning Amentum’s earnings are being priced at several turns higher than both its sector and closest comparables.
Explore the SWS fair ratio for Amentum Holdings
Result: Price-to-earnings of 111.2x (OVERVALUED)
However, investors still face risks, including potential contract timing hiccups and margin pressure if integration or large scale engineering projects prove more complex than expected.
Find out about the key risks to this Amentum Holdings narrative.
Another View: What Does DCF Say?
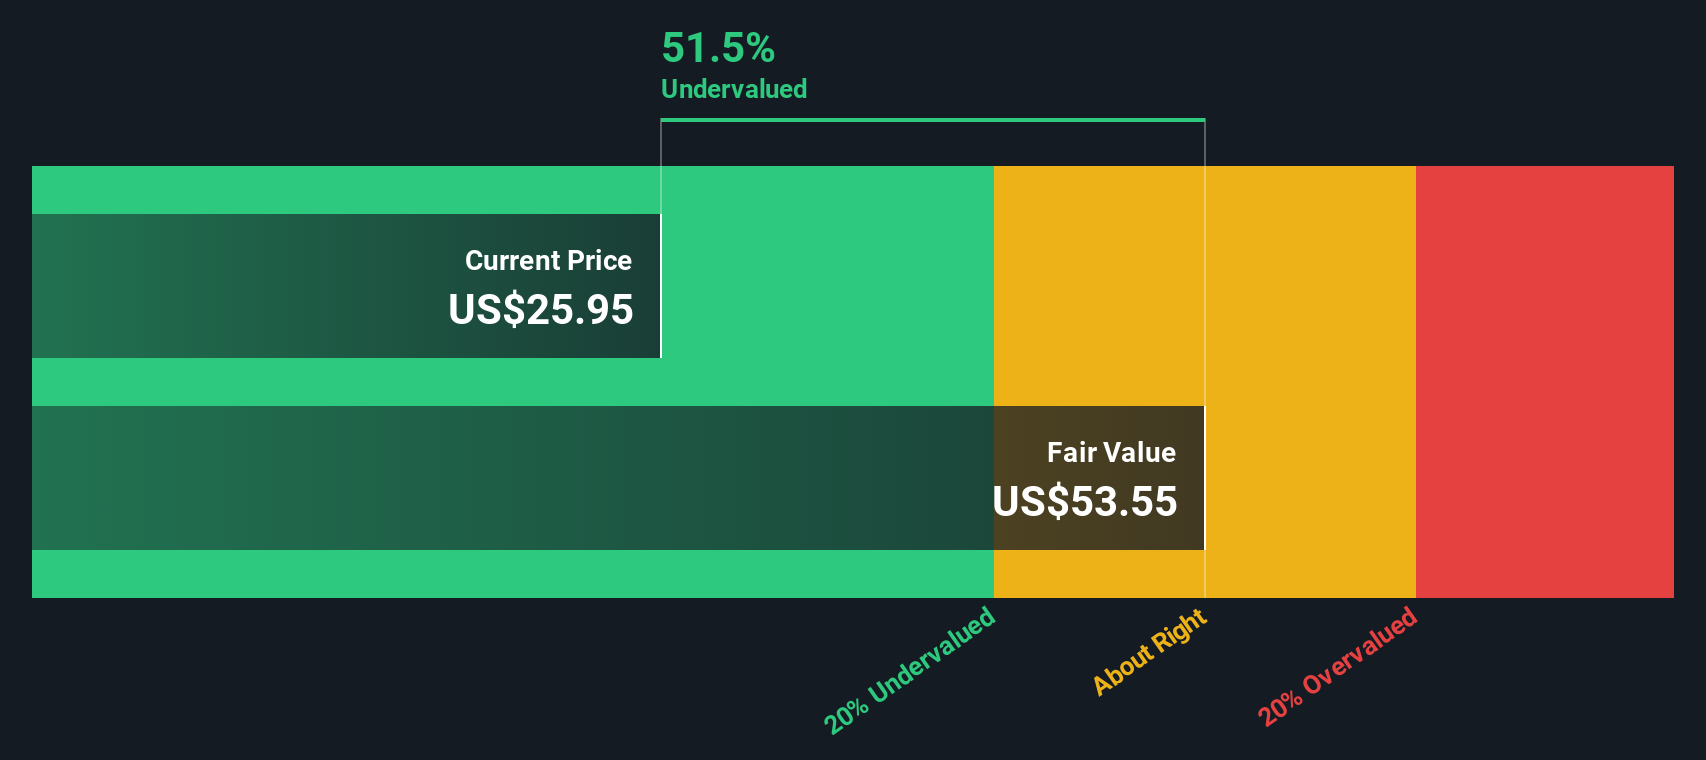
While the price to earnings number suggests overvaluation, our DCF model presents a different view, indicating that Amentum’s fair value is around $68.23 per share, approximately 56% above today’s $30.13 price. Is the market overlooking a long runway of cash flow, or is the model too optimistic?
Look into how the SWS DCF model arrives at its fair value.
Simply Wall St performs a discounted cash flow (DCF) on every stock in the world every day (check out Amentum Holdings for example). We show the entire calculation in full. You can track the result in your watchlist or portfolio and be alerted when this changes, or use our stock screener to discover 907 undervalued stocks based on their cash flows. If you save a screener we even alert you when new companies match - so you never miss a potential opportunity.
Build Your Own Amentum Holdings Narrative
If you see the data differently or simply prefer your own due diligence, you can build a personalized view of Amentum in minutes: Do it your way.
A great starting point for your Amentum Holdings research is our analysis highlighting 3 key rewards and 2 important warning signs that could impact your investment decision.
Ready for more high conviction ideas?
Smart investors never stop sharpening their edge, and the Simply Wall St Screener can help you spot tomorrow’s winners before the crowd catches on.
- Capture potential mispricings by targeting companies trading below intrinsic value using these 907 undervalued stocks based on cash flows.
- Ride structural growth trends in automation and data by focusing on future facing innovators through these 25 AI penny stocks.
- Lock in more reliable income streams by zeroing in on quality payers with these 12 dividend stocks with yields > 3%.
This article by Simply Wall St is general in nature. We provide commentary based on historical data and analyst forecasts only using an unbiased methodology and our articles are not intended to be financial advice. It does not constitute a recommendation to buy or sell any stock, and does not take account of your objectives, or your financial situation. We aim to bring you long-term focused analysis driven by fundamental data. Note that our analysis may not factor in the latest price-sensitive company announcements or qualitative material. Simply Wall St has no position in any stocks mentioned.
Have feedback on this article? Concerned about the content? Get in touch with us directly. Alternatively, email editorial-team@simplywallst.com