
 Nasdaq
 華爾街日報
華爾街日報Oxford Industries (OXM) Q3 Loss Deepens, Dividend Sustainability Worries Reinforce Bearish Narratives
Oxford Industries (OXM) just turned in a messy Q3 2026, with revenue of about $307 million and a basic EPS of roughly -$4.28, while trailing twelve month figures show revenue of about $1.5 billion and basic EPS hovering around -$0.19 as the business works through a choppy earnings patch. The company has seen quarterly revenue move from roughly $308 million in Q3 2025 to $307 million in Q3 2026, alongside a swing in basic EPS from about -$0.25 to -$4.28, leaving investors focused on how much underlying profitability has compressed beneath the headline sales line.
See our full analysis for Oxford Industries.With the numbers on the table, the next step is to weigh them against the prevailing Oxford Industries story and test how the latest margin pressure and loss profile line up with the market’s expectations.
See what the community is saying about Oxford Industries
Trailing Losses Versus Five Year Improvement
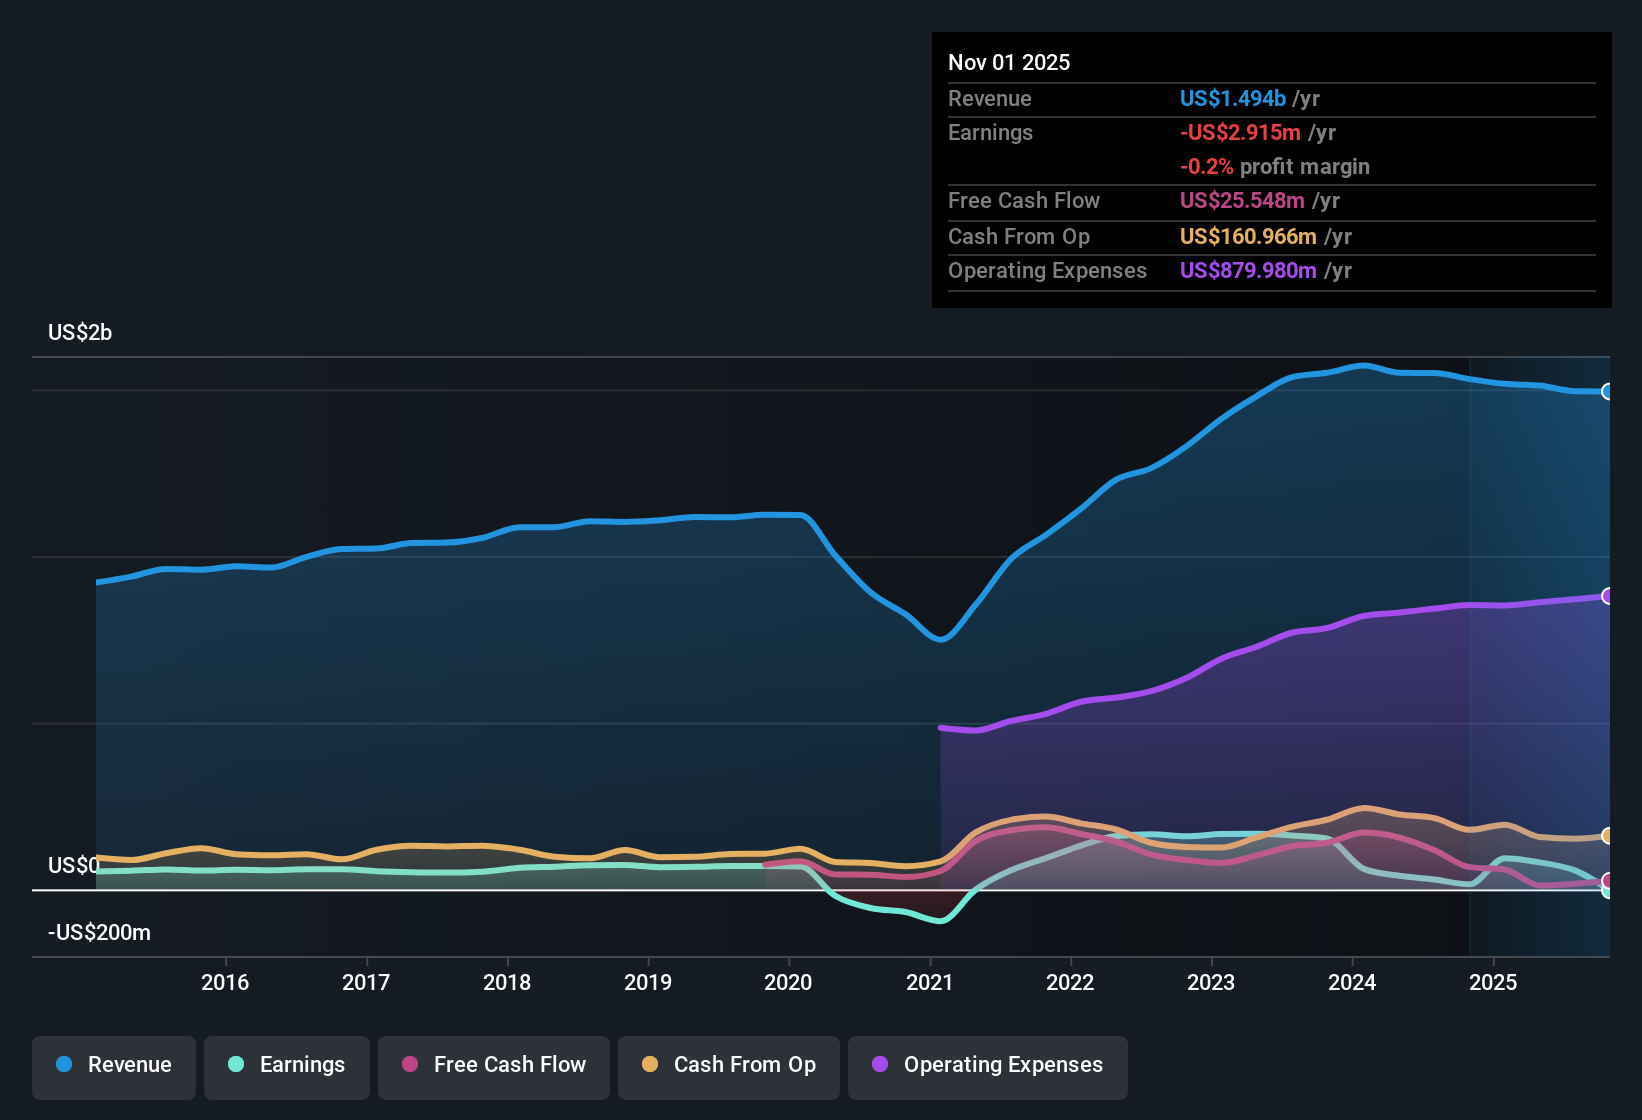
- On a trailing basis, Oxford Industries has about $1.5 billion in revenue and a net loss of roughly $2.9 million, while longer term data shows losses shrinking at an average rate of about 6.2 percent per year over the past five years.
- Consensus narrative notes that management is investing in omnichannel platforms, new retail locations, and infrastructure to support brands like Tommy Bahama and Lilly Pulitzer.
- Yet the latest trailing 12 month figures still show the business just below breakeven, with Basic EPS at about negative $0.19 despite that multi year effort to narrow losses.
- This combination of heavy brand and infrastructure investment with only modest revenue growth of roughly 1 percent per year keeps the bullish case heavily reliant on future operational follow through rather than current profitability.
Price To Sales Looks Cheap, DCF Less So
- At a share price of $31.86, Oxford Industries trades at a price to sales multiple of roughly 0.3 times, which is lower than both the US Luxury industry at about 0.7 times and its peers at about 1.2 times, even though that price sits above a DCF fair value of roughly $16.39 per share.
- Where the consensus narrative leans on steady but modest growth and a path to mid single digit margins,
- The current low price to sales multiple strongly supports the bullish view that the market is discounting these brands relative to industry benchmarks, especially given forecasts that earnings could reach about $59.7 million by around 2028.
- At the same time, the gap between the $31.86 share price and the $16.39 DCF fair value underscores a more cautious angle that challenges bulls to justify today’s valuation with that slower 1.2 percent annual revenue growth assumption.
Income Statement Hit And Dividend Strain
- Net income swung from a profit of about $16.7 million in Q2 2026 to a loss of roughly $63.7 million in Q3 2026, and this comes on top of a dividend yield of about 8.66 percent that current earnings and free cash flow are flagged as not covering well.
- Critics highlight that economic pressures and heavier promotions are weighing on margins,
- And the sharp move from positive Basic EPS of roughly $1.12 in Q2 2026 to about negative $4.28 in Q3 2026 gives the bearish view concrete support when arguing that profitability is vulnerable to softer consumer demand and clearance activity.
- When that earnings volatility is combined with an 8.66 percent dividend that is not well supported by profits or cash flows, the bearish concern that shareholder distributions could face pressure if trends persist is firmly grounded in the latest income statement trajectory.
Next Steps
To see how these results tie into long-term growth, risks, and valuation, check out the full range of community narratives for Oxford Industries on Simply Wall St. Add the company to your watchlist or portfolio so you'll be alerted when the story evolves.
See the numbers differently? Take a moment to dig into the data, shape your own view in just a few minutes, and Do it your way.
A great starting point for your Oxford Industries research is our analysis highlighting 2 key rewards and 1 important warning sign that could impact your investment decision.
See What Else Is Out There
Oxford Industries is wrestling with shrinking profitability, a sharp swing into quarterly losses, and an uncovered high dividend that leaves shareholder payouts looking vulnerable.
If you want income that is better supported by earnings and cash flow, use our these 1932 dividend stocks with yields > 3% today to quickly surface companies with more sustainable yields.
This article by Simply Wall St is general in nature. We provide commentary based on historical data and analyst forecasts only using an unbiased methodology and our articles are not intended to be financial advice. It does not constitute a recommendation to buy or sell any stock, and does not take account of your objectives, or your financial situation. We aim to bring you long-term focused analysis driven by fundamental data. Note that our analysis may not factor in the latest price-sensitive company announcements or qualitative material. Simply Wall St has no position in any stocks mentioned.
Have feedback on this article? Concerned about the content? Get in touch with us directly. Alternatively, email editorial-team@simplywallst.com