
 Nasdaq
 華爾街日報
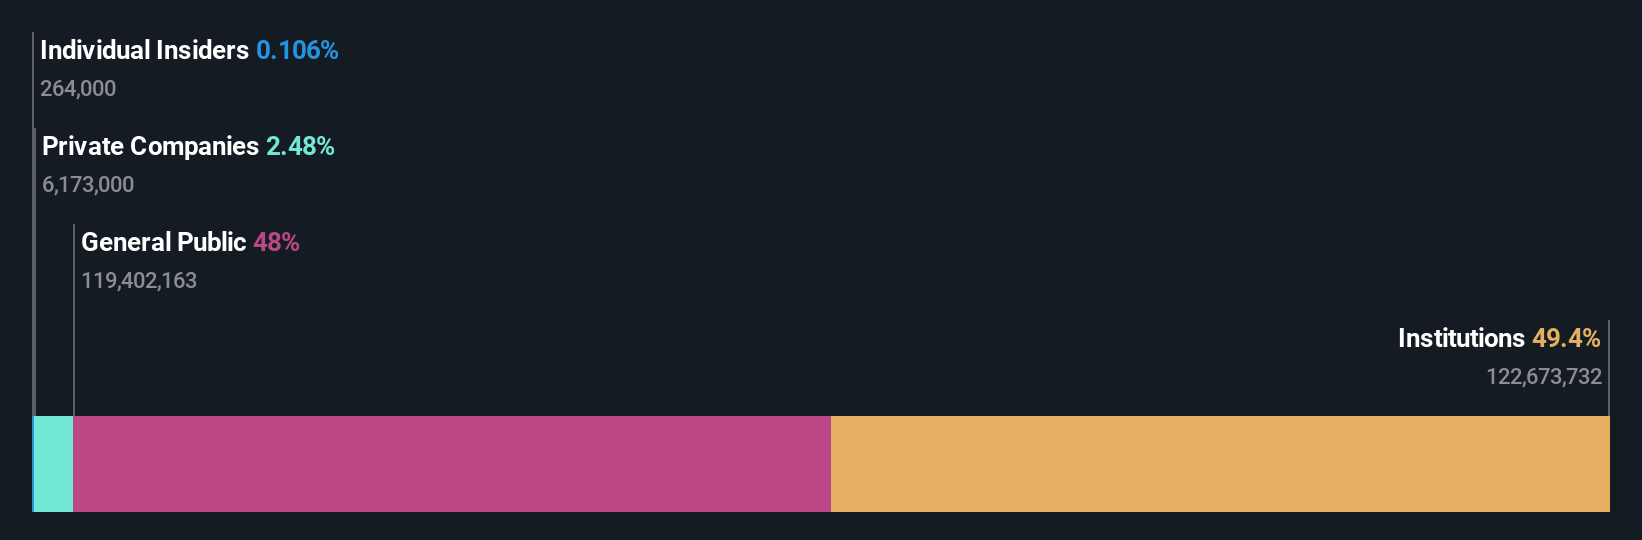
華爾街日報With 49% ownership, J. Front Retailing Co., Ltd. (TSE:3086) has piqued the interest of institutional investors
Key Insights
- Institutions' substantial holdings in J. Front Retailing implies that they have significant influence over the company's share price
- A total of 22 investors have a majority stake in the company with 50% ownership
- Ownership research along with analyst forecasts data help provide a good understanding of opportunities in a stock
Every investor in J. Front Retailing Co., Ltd. (TSE:3086) should be aware of the most powerful shareholder groups. We can see that institutions own the lion's share in the company with 49% ownership. That is, the group stands to benefit the most if the stock rises (or lose the most if there is a downturn).
Since institutional have access to huge amounts of capital, their market moves tend to receive a lot of scrutiny by retail or individual investors. Therefore, a good portion of institutional money invested in the company is usually a huge vote of confidence on its future.
Let's take a closer look to see what the different types of shareholders can tell us about J. Front Retailing.
See our latest analysis for J. Front Retailing
What Does The Institutional Ownership Tell Us About J. Front Retailing?
Many institutions measure their performance against an index that approximates the local market. So they usually pay more attention to companies that are included in major indices.
J. Front Retailing already has institutions on the share registry. Indeed, they own a respectable stake in the company. This implies the analysts working for those institutions have looked at the stock and they like it. But just like anyone else, they could be wrong. It is not uncommon to see a big share price drop if two large institutional investors try to sell out of a stock at the same time. So it is worth checking the past earnings trajectory of J. Front Retailing, (below). Of course, keep in mind that there are other factors to consider, too.

Hedge funds don't have many shares in J. Front Retailing. BlackRock, Inc. is currently the largest shareholder, with 5.4% of shares outstanding. In comparison, the second and third largest shareholders hold about 5.2% and 4.0% of the stock.
Looking at the shareholder registry, we can see that 50% of the ownership is controlled by the top 22 shareholders, meaning that no single shareholder has a majority interest in the ownership.
While studying institutional ownership for a company can add value to your research, it is also a good practice to research analyst recommendations to get a deeper understand of a stock's expected performance. Quite a few analysts cover the stock, so you could look into forecast growth quite easily.
Insider Ownership Of J. Front Retailing
The definition of company insiders can be subjective and does vary between jurisdictions. Our data reflects individual insiders, capturing board members at the very least. The company management answer to the board and the latter should represent the interests of shareholders. Notably, sometimes top-level managers are on the board themselves.
I generally consider insider ownership to be a good thing. However, on some occasions it makes it more difficult for other shareholders to hold the board accountable for decisions.
Our information suggests that J. Front Retailing Co., Ltd. insiders own under 1% of the company. However, it's possible that insiders might have an indirect interest through a more complex structure. Keep in mind that it's a big company, and the insiders own JP¥579m worth of shares. The absolute value might be more important than the proportional share. Arguably, recent buying and selling is just as important to consider. You can click here to see if insiders have been buying or selling.
General Public Ownership
With a 48% ownership, the general public, mostly comprising of individual investors, have some degree of sway over J. Front Retailing. While this size of ownership may not be enough to sway a policy decision in their favour, they can still make a collective impact on company policies.
Next Steps:
I find it very interesting to look at who exactly owns a company. But to truly gain insight, we need to consider other information, too. Consider for instance, the ever-present spectre of investment risk. We've identified 2 warning signs with J. Front Retailing , and understanding them should be part of your investment process.
But ultimately it is the future, not the past, that will determine how well the owners of this business will do. Therefore we think it advisable to take a look at this free report showing whether analysts are predicting a brighter future.
NB: Figures in this article are calculated using data from the last twelve months, which refer to the 12-month period ending on the last date of the month the financial statement is dated. This may not be consistent with full year annual report figures.
Have feedback on this article? Concerned about the content? Get in touch with us directly. Alternatively, email editorial-team (at) simplywallst.com.
This article by Simply Wall St is general in nature. We provide commentary based on historical data and analyst forecasts only using an unbiased methodology and our articles are not intended to be financial advice. It does not constitute a recommendation to buy or sell any stock, and does not take account of your objectives, or your financial situation. We aim to bring you long-term focused analysis driven by fundamental data. Note that our analysis may not factor in the latest price-sensitive company announcements or qualitative material. Simply Wall St has no position in any stocks mentioned.